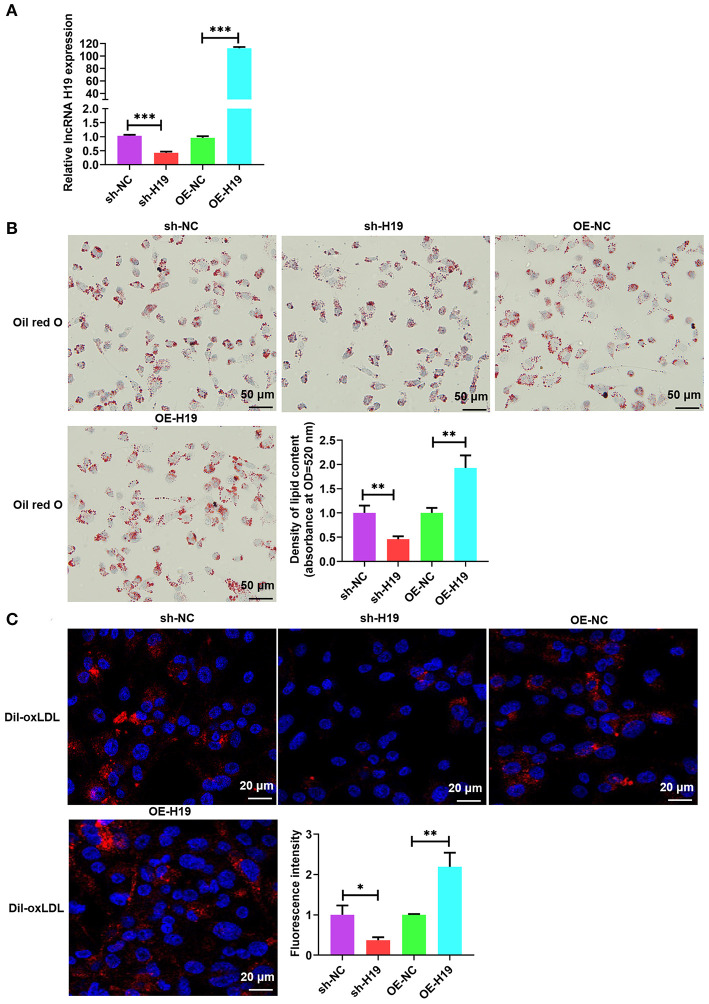
Figure 2.
lncRNA H19 facilitated lipid accumulation in ox-LDL-treated THP-1 cells. (A–C) THP-1 cells were transfected with sh-NC, sh-H19, OE-NC, or OE-H19 for 48 h. (A) lncRNA H19 expression was determined using RT-PCR (n = 3). (B) Oil red O-stained cells were treated with ox-LDL (100 μg/mL) and evaluated after lncRNA H19 knockdown or overexpression. Typical images of oil red O staining results (200×). Isopropanol extraction was performed for oil red O staining. Oil red O absorbance after isopropanol extraction was measured by quantifying lipids. Illustrative images of oil red O staining (200×). Scale bar = 50 μm. (C) Illustrative images demonstrating Dil-ox-LDL uptake after incubation for 1 h. The calculation of the fluorescence intensity was done utilizing Image J. Data are represented as mean ± SD of 3 separate experiments. *P < 0.05, **P < 0.01, and ***P < 0.001 vs. the control cohort.

