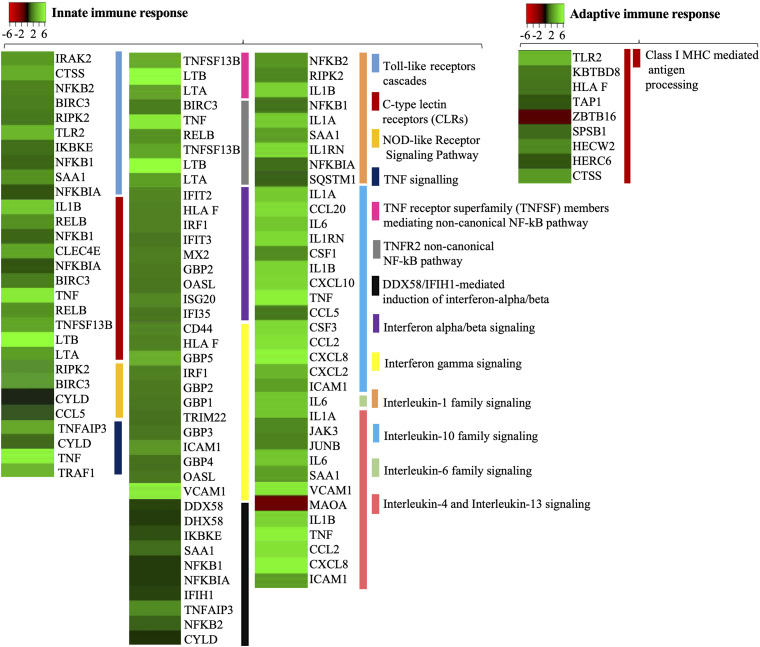
FIGURE 4.
The differentially expressed genes related to the immune response in hBMECs activated by B. bavariensis. Heat maps showing biological processes related to the immune response. Green shaded genes—upregulated, red shaded genes—downregulated. The intensity of the color indicates the degree of expression level. The range of the fold change (logFC) is presented in the scale.

