FIGURE 4.

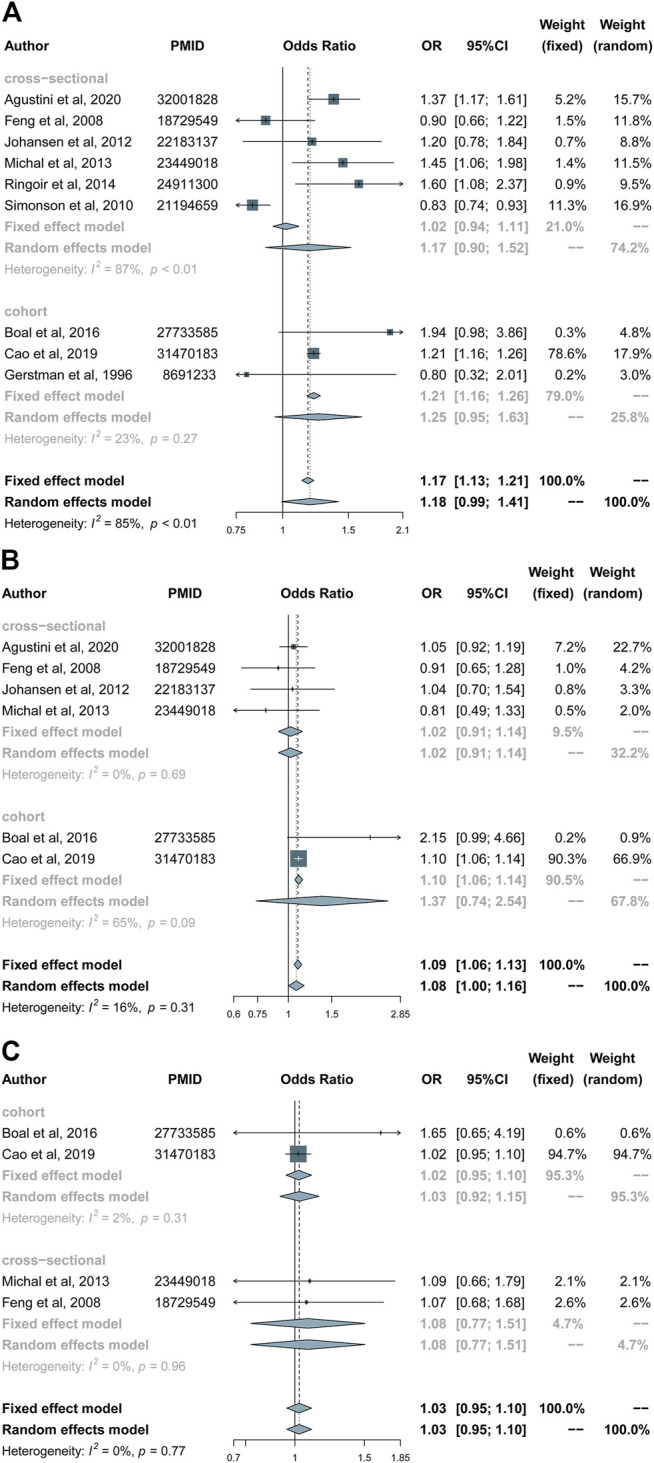
Forest plots of subgroup analysis according to the type of study (cohort/cross-sectional): (A) Beta blockers group. (B) Calcium channel blockers group. (C) Diuretics group.

Forest plots of subgroup analysis according to the type of study (cohort/cross-sectional): (A) Beta blockers group. (B) Calcium channel blockers group. (C) Diuretics group.