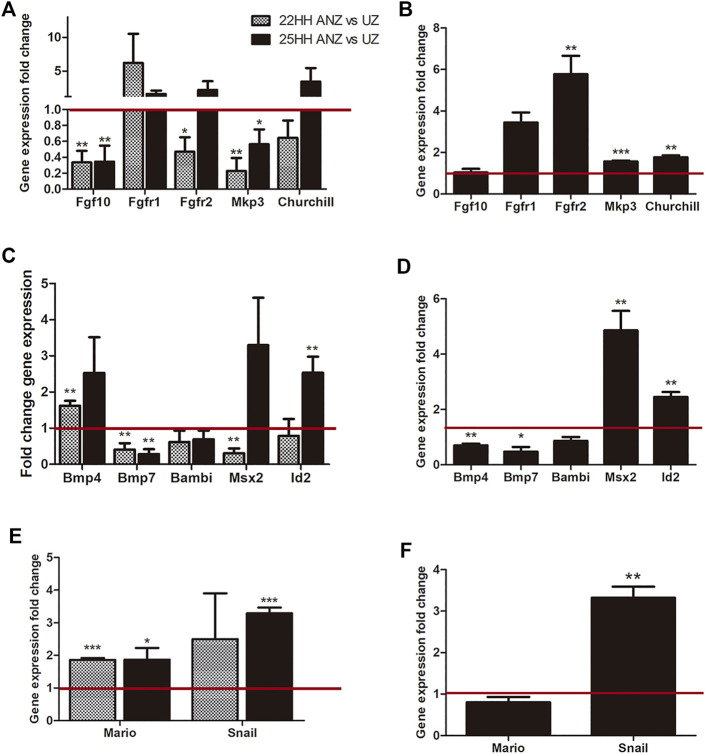
FIGURE 7.
qRT-PCR analysis and comparison dynamics of gene expression in the presumptive ANZ and the ANZ. qRT-PCR of FGF-related genes (Fgf10, Fgfr1, Fgfr2, Mkp3, Churchill) and BMP-related genes (Bmp4, Bmp7, Bambi, Mario, Snail). (A, C, E) Comparison of gene expression between the presumptive ANZ in 22 HH vs its undifferentiated zone (UZ) and between the ANZ versus its UZ. (B, D, F) Analysis of gene expression in the ANZ at 25 HH stage relative to the presumptive ANZ at 22 HH stage (set to 1.0, red line). Data represent three independent experiments. Statistical significance was set as follows: ***p < 0.0001, **p < 0.005, *p < 0.05.

