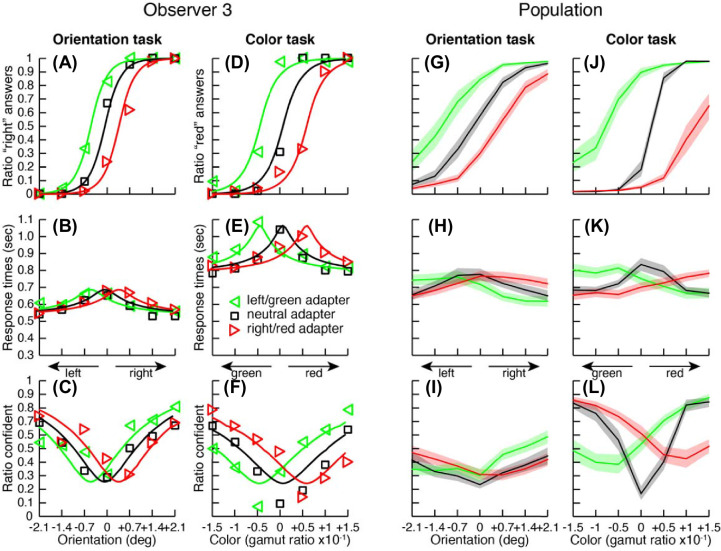
Figure 3.
Results for Experiment 1. (A–L) Results from the after-effect experiment for one observer (A–F) and for the population (G–L, N = 16). The first column (A–C) depicts the results for the orientation task: (A) Proportion of “right” responses (markers) as a function of grating orientation (abscissa) for the three adapter orientations (markers color) together with predictions from a model implementing confidence as the distance between two competing accumulators (lines; see Supplementary Material S7). (B) Median response times of the perceptual decision. (C) Proportion of perceptual decisions judged more confident than the other perceptual decision. The second column (D–F) depicts the results for the color discrimination task in the same format (replacing “red” for “right” decisions). Population results (G–L) are depicted in the same format as the individual observer. The solid lines represent the mean data and the shaded areas the standard errors across observers.

