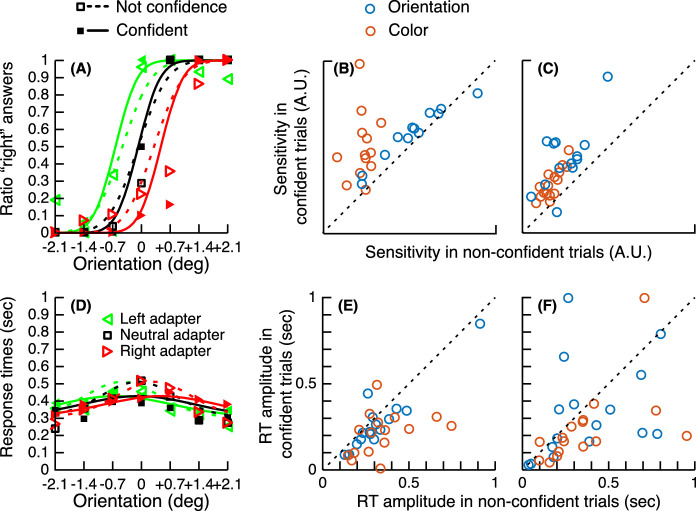
Figure 5.
Relationship between confidence judgments and perceptual decisions (sensitivity and response times). (A) Perceptual reports plotted separately for confident (filled markers) and not confident (empty markers) trials and associated psychometric functions (solid and dashed lines) for the orientation task for the same observer as Figure 2. (B) Sensory thresholds in confident trials as a function of sensory thresholds in non-confident trials. Points below the diagonal indicate that observers were better (higher sensitivity) in the confident trials than in the non-confident trials. (C) Same as (B) for the “prior” experiment. (D) Same as (A) for the chronometric functions. (E) Chronometric functions amplitude (maximum response time of the distribution shown in panel D) in confident trials as a function of amplitude in non-confident trials. Points below the diagonal indicate that observers were faster (lower peak response times) in the confident trials than in the non-confident trials. (F) Same as (E) for the “prior” experiment.

