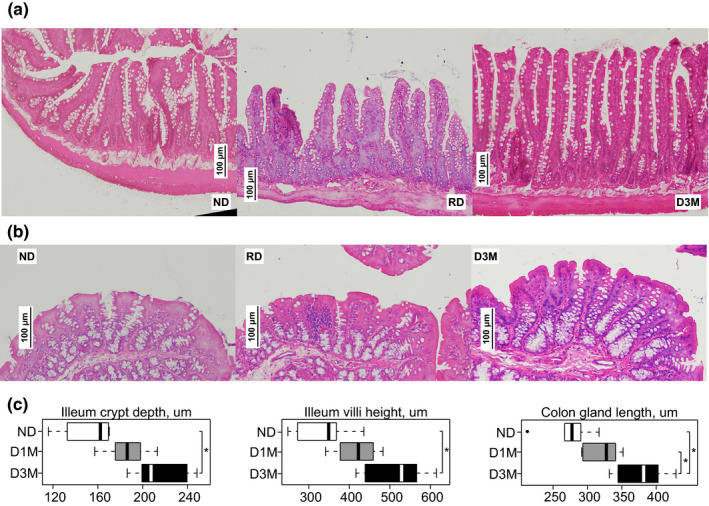
FIGURE 1.

Histomorphometric analysis of (a) ileum and (b) colon epithelia from UC Davis Type 2 Diabetes Mellitus (UCD‐T2DM) rats. Data are median and IQR (c) of UCD‐T2DM rats that are either non‐diabetic (ND, n = 6), recent onset of diabetes (D1M, n = 6), and 3‐month post‐onset of diabetes (D3M, n = 6). Twenty measurements were assessed per slide and then averaged for final estimate. Ileum crypt depth and villi height are indicated in micrometers on x‐axis of boxplots. Colon crypt depth is indicated in micrometers on x‐axis of boxplots. Group differences assessed by ANOVA followed by Tukey's honestly significant difference (HSD) test. * indicates statistical significance, p < 0.05
