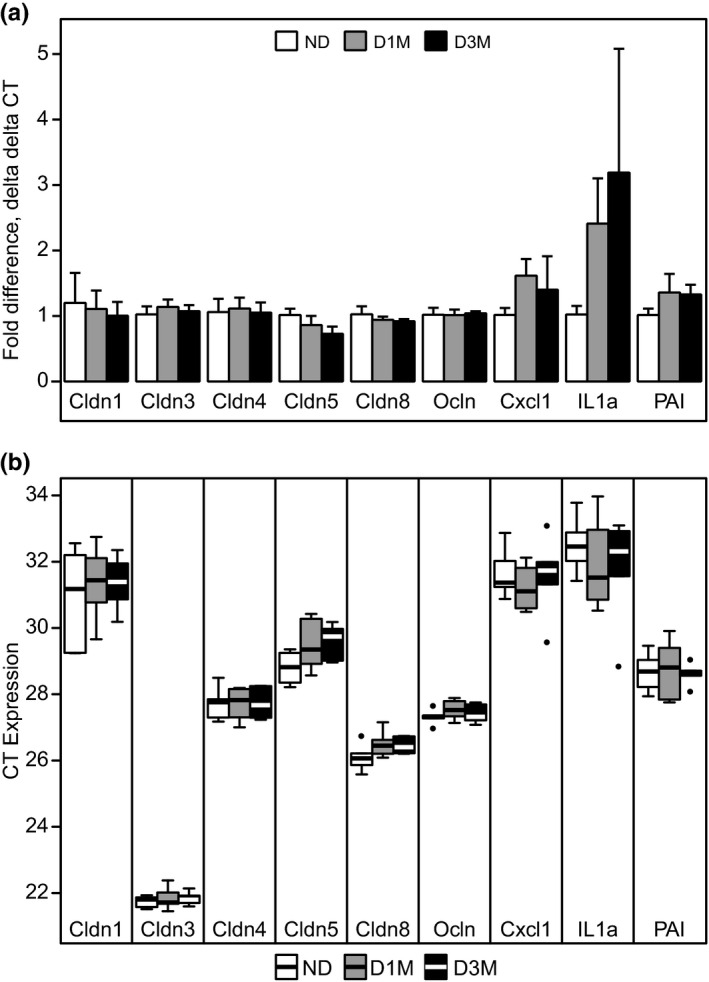
FIGURE 3.

Colon gene expression levels of tight junction and markers of inflammation from UC Davis Type 2 Diabetes Mellitus (UCD‐T2DM) rats that were non‐diabetic (ND, n = 6), had recent diabetes (2‐week post‐onset of diabetes; D1M, n = 6), or 3‐month post‐onset of diabetes (D3M, n = 6). (a) Data are mean and SEM of fold differences using the delta delta CT method. ND rats were considered the control group to calculate delta delta CT. (b) Data are mean and standard error of the mean (SEM) of raw cycle threshold (CT) values. Kruskal–Wallis test was used to assess group differences at p < 0.05. No group differences were observed for any gene
