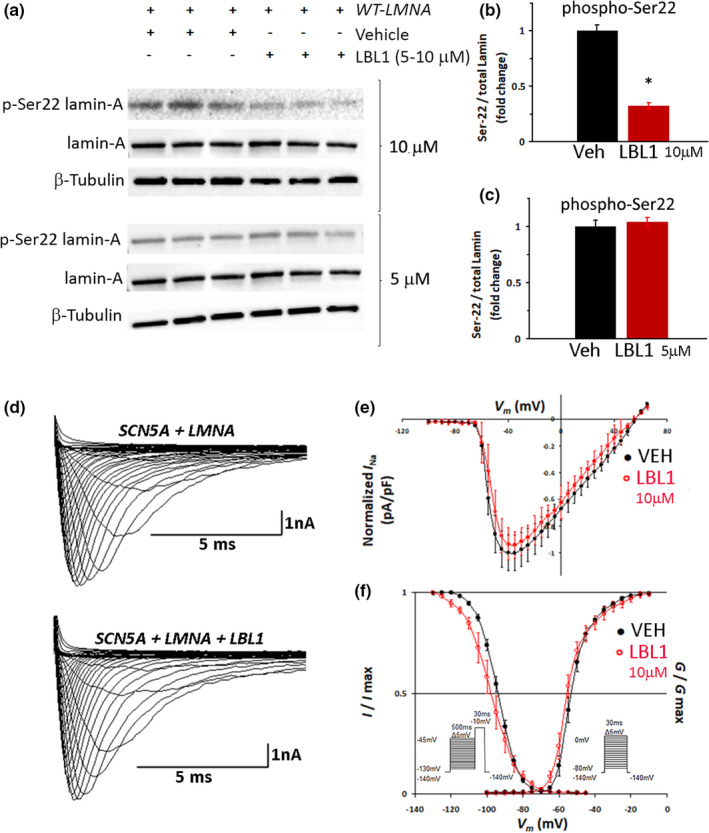
FIGURE 5.

LBL1 decreases Ser 22 Phosphorylation but does not alter I Na . (a) Representative western blot of HEK‐293 cells transfected with WT‐LMNA and treated with 10 µM LBL1 (top) or 5 µM LBL1 (bottom). (b, c) Quantification of Ser 22 phosphorylation in cells treated with vehicle, 10 µM (b) or 5 µM (c) LBL1 (red bars). N = 6; *p < 0.05. Ser 22 phosphorylation in vehicle‐treated cells was set at 1. (d) Representative superimposed current traces obtained from respective cells. (e) I–V relationship of cells co‐transfected with SCN5A + WT‐LMNA; vehicle (black), N = 10 versus 10 µM LBL1 (red), N = 7. Peak current for vehicle is set at 1. (f) Voltage‐dependency of the steady‐state inactivation and activation of cells co‐transfected with SCN5A + WT‐LMNA. Inactivation: vehicle (black), N = 10 versus 10 µM LBL1 (red), N = 8; p = N.S. Activation: vehicle (black), N = 10 versus 10 µM LBL1 (red), N = 7; p = N.S. Insets show pre‐pulse inactivation (left) and step‐pulse activation (right) protocols. Data are mean ± SE
