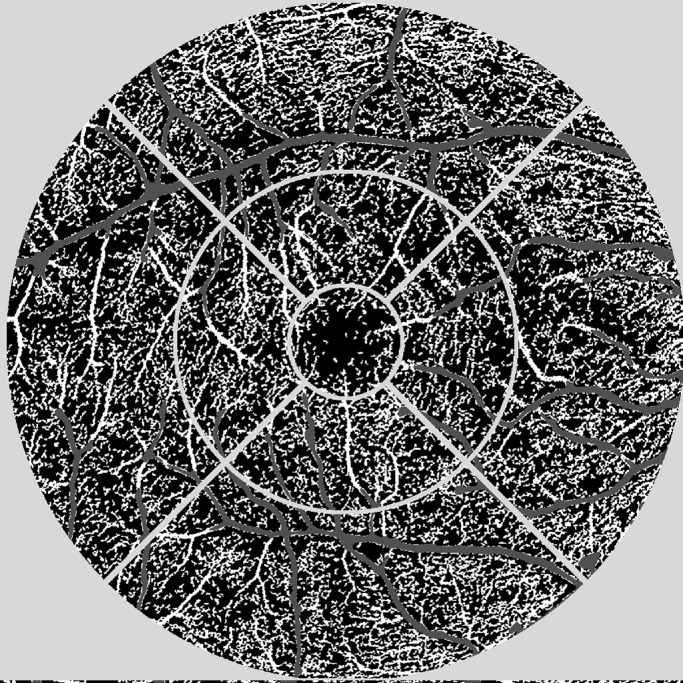
Figure 1.

Illustration of the OCTA image analysis algorithm. A nine-field, fovea-centered grid was used as an overlay on the exported images (light gray). Using a predefined flow signal threshold, large vessels (dark gray) were excluded from the analysis. Perfused vessel density is shown in white.
