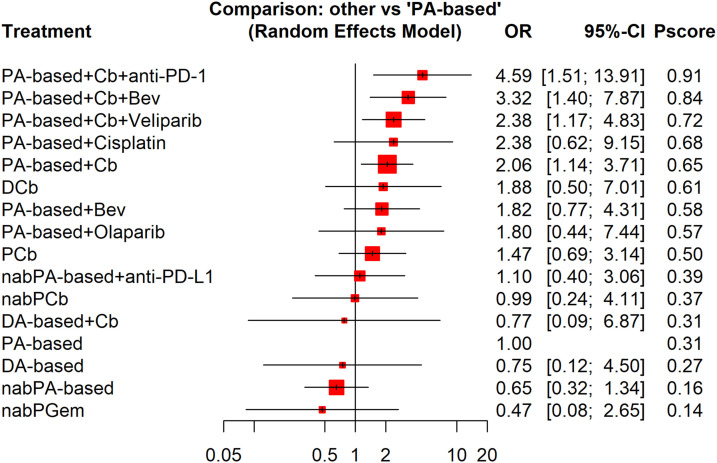
Figure 4.
Forest plot of odds ratios for pathological complete response of neoadjuvant therapies compared with the reference arm (paclitaxel-anthracycline-based therapy) by network meta-analysis. The squares in the figure represent hazard ratios (OR) for each trial, and the horizontal lines indicate the 95% confidential interval (CI) for the OR. The diamond represents the pooled OR, as based on a random-effect method. All statistical tests were 2-sided.

