Figure 2.
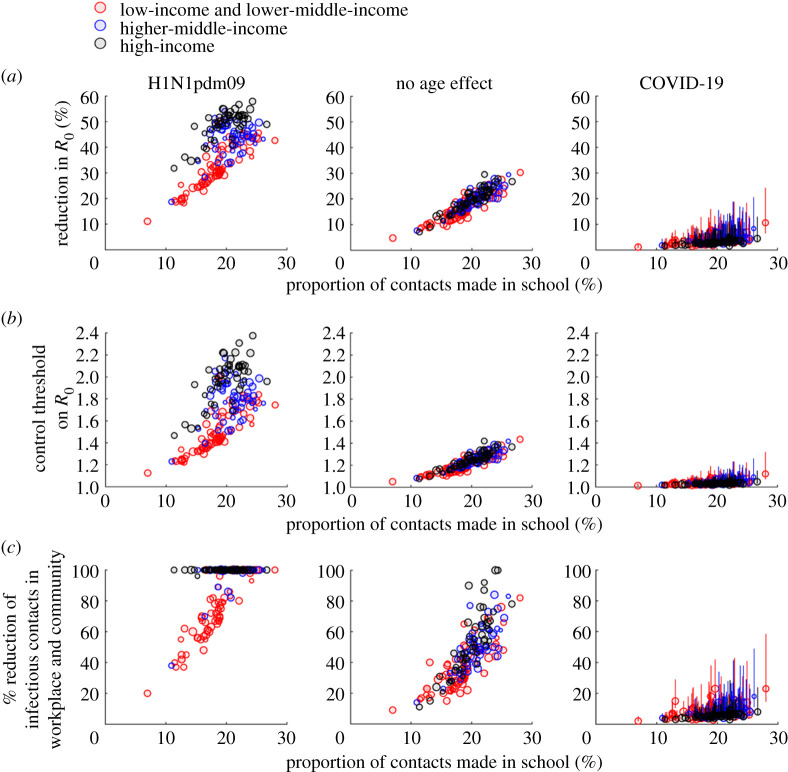
The effectiveness of school closure in reducing transmissibility as a function of proportion of contacts made in school across 177 jurisdictions. See electronic supplementary material, table S4 for the numerical values of all data points shown here. The sizes of data points are proportional to the log of the corresponding population size. Circles and bars (for COVID-19) indicate point predictions and 95% prediction intervals, respectively. (a) Reduction in R0 conferred by school closure against H1N1pdm09 (left), a pathogen to which individual of all ages were equally susceptible (middle) and COVID-19 (right). (b) Outbreak threshold (in terms of R0) under school closure. (c) Per cent reduction in workplace and community contacts that would be required in order to achieve the reduction in R0 conferred by school closure. A required percentage of 100% means that this was impossible. (Online version in colour.)

