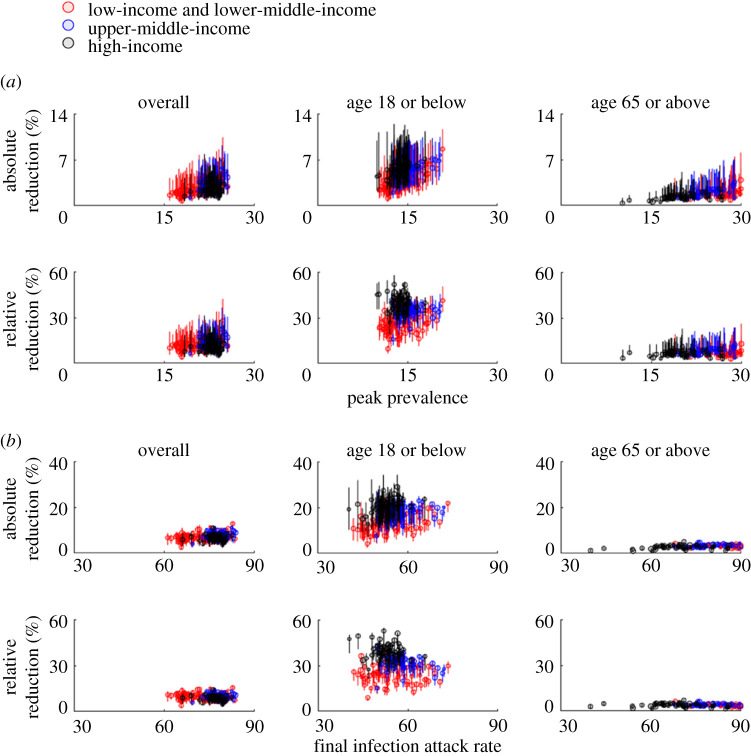
Figure 3.
The public health impact of school closure across 177 jurisdictions when R0 = 2.5. See electronic supplementary material, table S4 for the numerical values of all data points shown here. Circles and bars indicate point predictions and 95% prediction intervals, respectively. (a) Reduction in peak prevalence for all ages (left), those aged 18 or below (middle) and those aged 65 or above (right). (b) Reduction in final IAR for all ages (left), those aged 18 or below (middle) and those aged 65 or above (right). (Online version in colour.)

