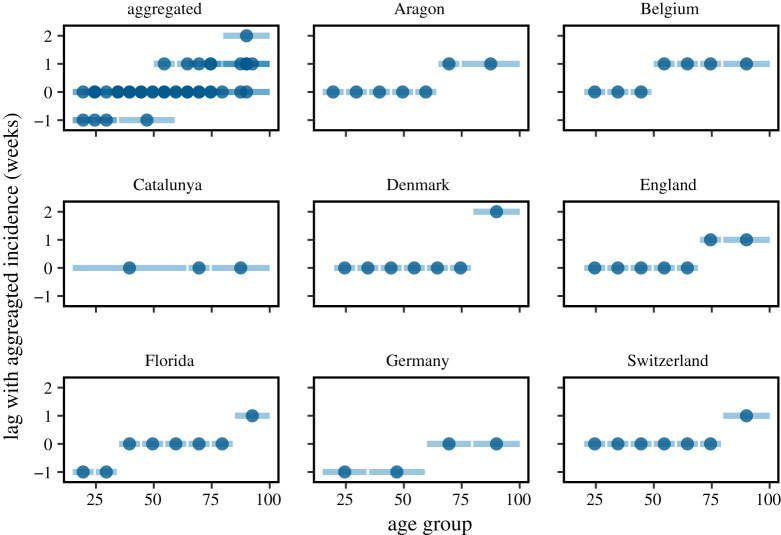
Figure 2.
Temporal difference between the peak in the absolute number of infections of a particular age group and the aggregation over all age groups. Lines show the range of the age groups, while dots indicate the mean between the limits. For all countries and regions, we show the second peak. An exception is Germany, whose second peak coincides with the Christmas holidays which made reporting unreliable, wherefore we show the delay for the first wave. (Online version in colour.)

