Figure 4.
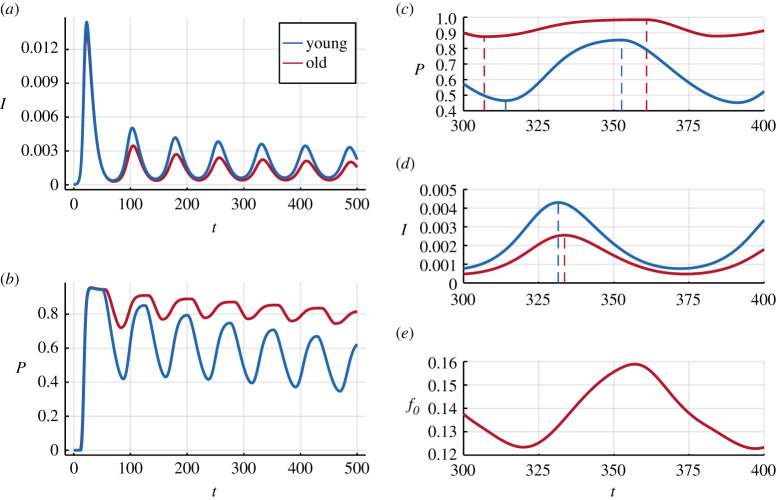
(a) Prevalence or fraction of infected individuals, and (b) fraction of protected individuals in the old (red) and young (blue) groups, evolving in time, with initial conditions fixed as in figure 3 for both groups. The adoption rate is fixed at and the infection costs are and respectively. (c) Fraction of protected individuals and (d) fraction of infected individuals in both groups displayed in a shorter time window. (e) The fraction of cases belonging to the old group in time. All results are obtained by numerically integrating equations (2.5)–(2.9) using a standard ODE solver, with fixed , and in both groups, , , and . (Online version in colour.)

