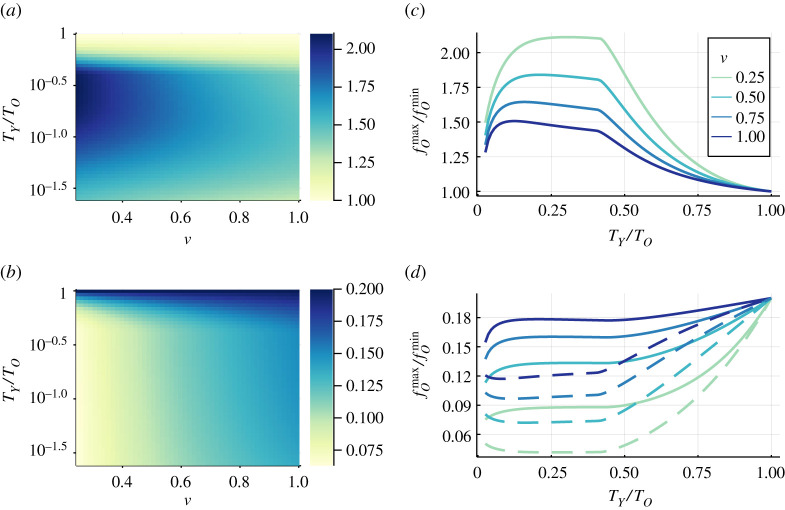
Figure 5.
Top: Ratio between maximum, , and minimum, , in the variation of the case distribution, i.e. in the fraction of infected individuals belonging to the old group, , in time depending on the mixing rate between the groups, , and the ratio of infection costs (a). We also show the dependence on the infection cost in the young group, when the infection cost for the old group is fixed, , for four choices of the mixing rate (c). Bottom: Average between maximum, , and minimum, , in the variation of the case distribution, depending on the mixing rate between the groups, , and the ratio of infection costs (b). We also show how the maximal (solid) and minimal (dashed) fraction of cases belonging to the old group depends again on the infection cost of the young group , when the infection cost for the old group is fixed, , for the same choices of the mixing rate (d). All results are obtained by numerically integrating equations (2.5)–(2.9) using a standard ODE solver, with fixed , and, in both groups, , , , and , and initial conditions in both groups. (Online version in colour.)

