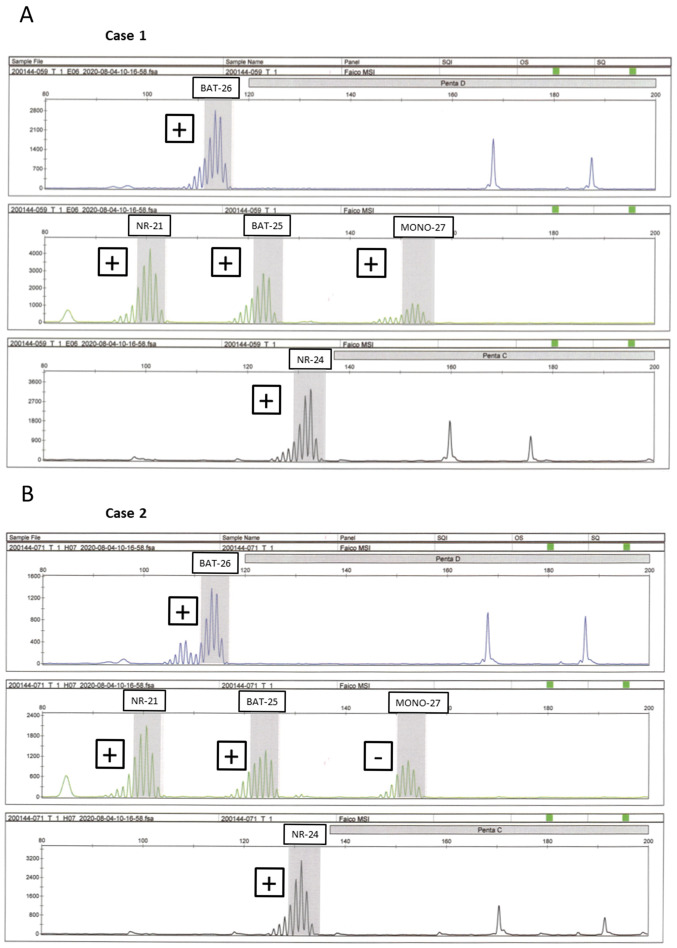
Figure 2.
Representative electropherograms of the cancer tissues exhibiting MSI-H. The presence of MSI for (A) case 1 and (B) case 2 is indicated. MSI-H is present when the maximal peak at each marker is situated outside the quasi-monomorphic variation range (gray zone). In cases 1 and 2, different-sized peaks were observed other than a distinctive peak from an allele (plus). Different-sized peaks were described as ‘positive’ and the results that did not yield peaks as ‘negative’. Five mononucleotide microsatellite markers: BAT25, BAT26, NR21, MONO-27 and NR24. MSI-H, MSI-high; MSI, microsatellite instability.

