
FIGURE 1.
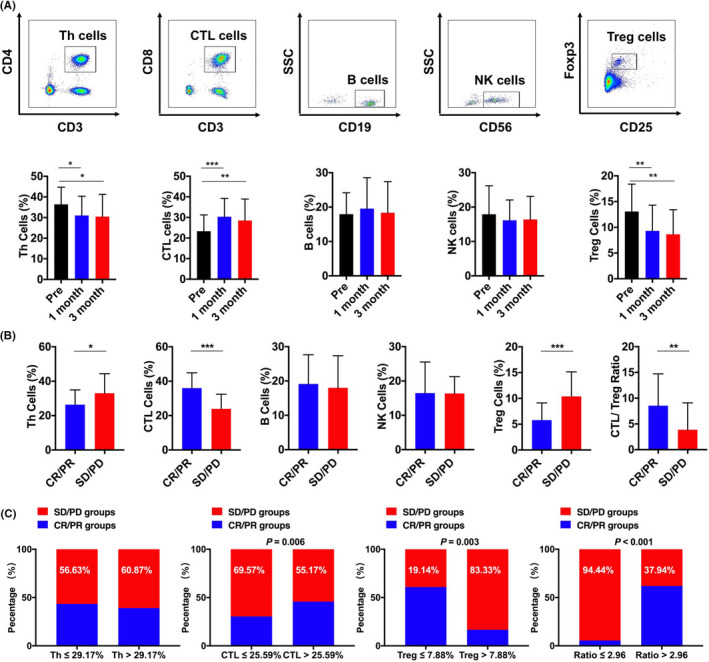
The change of immune cells from patients with HCC after lenvatinib therapy. (A) Frequency of CD4+ Th cells, CD8+CTL cells, Treg cells, B cells, and NK cells pretreatment and after 1 and 3 months. (B) The frequency of Th cells, CTL cells, B cells, NK cells, and CTL/Treg ratio in CR/ PR group and SD/ PD group. (C) The percentage of poor outcome in Th group, CTL group, Treg group, and CTL/Treg ratio group. * p < 0.05; ** p < 0.01; *** p < 0.001