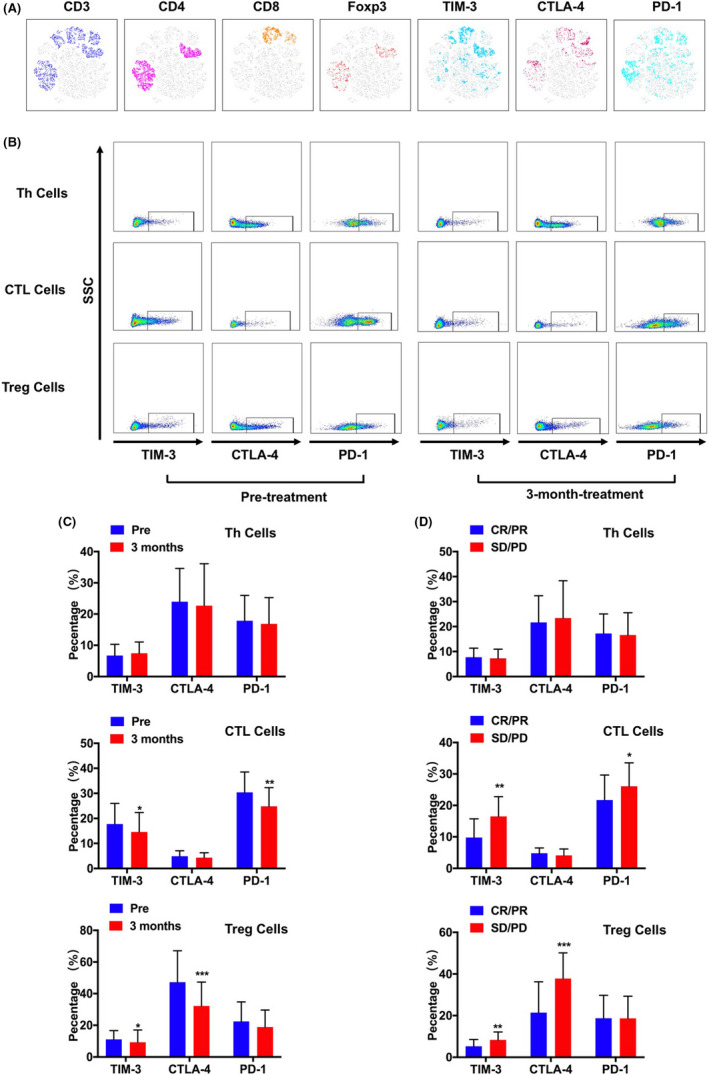
FIGURE 4.

The expression of immune checkpoint receptors from immune cells of patients with HCC were measured by flow cytometry followed by viSNE analysis. (A) The expression of CD3, CD4, CD8, TIM‐3, CTLA‐4, and PD‐1 was indicated by the different color. (B) Representative flow cytometry result showing the expression level of TIM‐3, CTLA‐4, and PD‐1 on Th cells, CTLA cells and Tregs. (C) The change of immune checkpoint receptors from immune cells pretreatment and after 3 months. (D) The expression level of immune checkpoint receptors on Th cells, CTLA cells, and Tregs in CR/ PR group and SD/ PD group. * p < 0.05; ** p < 0.01; *** p < 0.001
