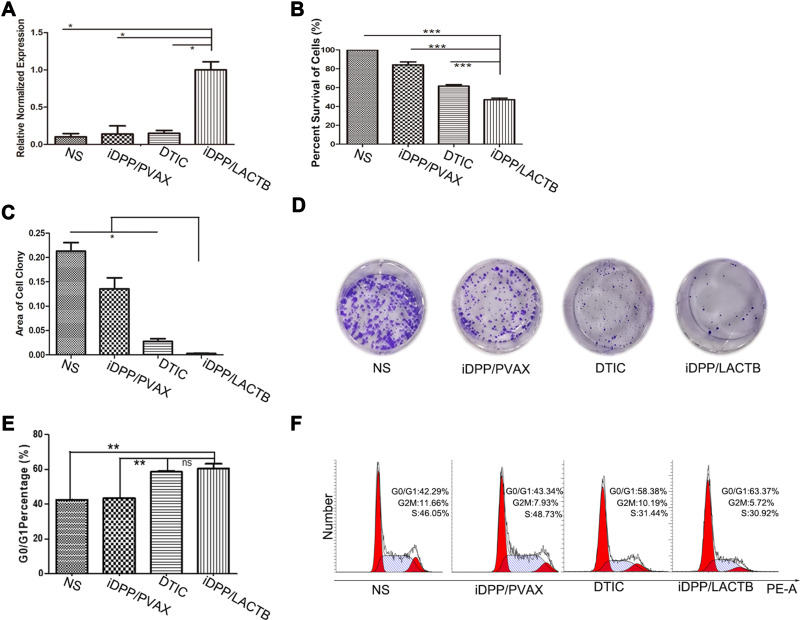
Figure 3.
Proliferation inhibition of iDPP/LACTB nanocomplexes on B16-F10 melanoma cells. (A) mRNA levels of LACTB gene in B16-F10 cells of the four groups after 48 h. (*p < 0.05, ***p < 0.001). (B) Cell proliferation inhibition rate of treatment detected by CCK8 assay after 48 h treatment. (***p < 0.001). (C and D) Images and analysis of colony formation test of B16-F10 cells after 7days’ treatment (*p < 0.05). (E and F) Cell cycle distribution of B16-F10 cells by flow cytometry. (**p < 0.01, ns, not significant).

