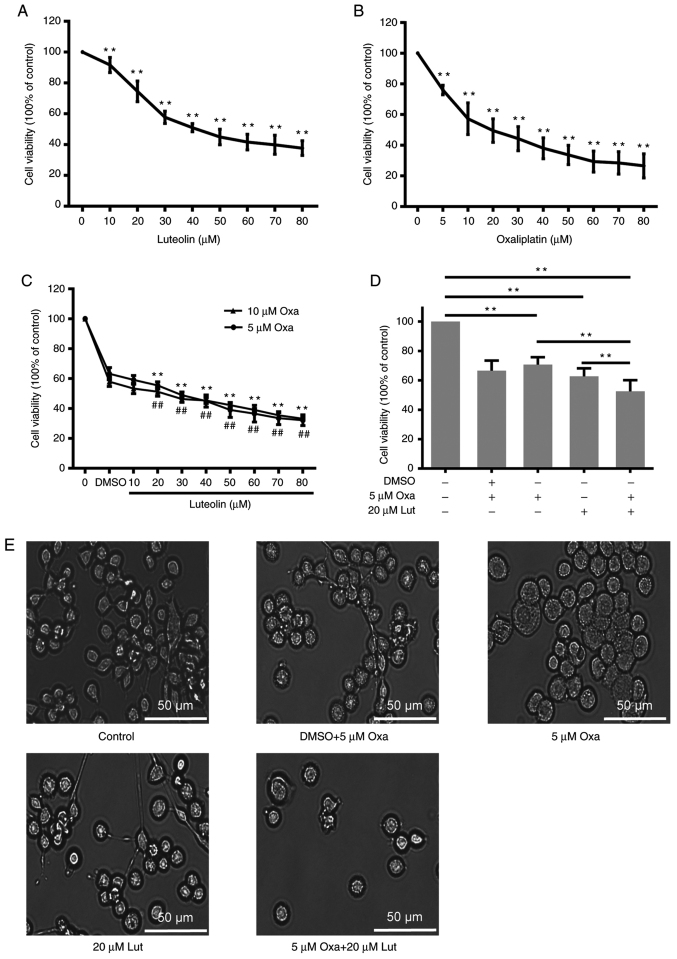
Figure 1.
Viability of MFC cells treated with luteolin and/or oxaliplatin. (A) Cell viability induced by a series of doses of luteolin was detected by CCK-8 assay. **P<0.01 vs. 0 group. (B) Cell viability induced by a series of doses of oxaliplatin was detected by CCK-8 assay. 5 μM Oxa: **P<0.01 vs. DMSO group; 10 μM Oxa: ##P<0.01 vs. DMSO group. (C) The combined effects of a series of doses of luteolin and/or oxaliplatin (5 and 10 µM) were evaluated by CCK-8 assay. **P<0.01 vs. DMSO group. (D) Quantitative analysis of cell viability was performed on MFC cells exposed to luteolin (20 µM) and/or oxaliplatin (5 µM) by using the GraphPad Prism 6.0 software. **P<0.01. (E) The morphological changes were observed under a light microscope (magnification, ×200). RPMI-1640 complete medium containing 0.1% DMSO was used as a control. The experiments were repeated ≥3 times. The data are presented as mean ± standard deviation (SD). Lut, luteolin; Oxa, oxaliplatin; MFC, mouse forestomach carcinoma.

