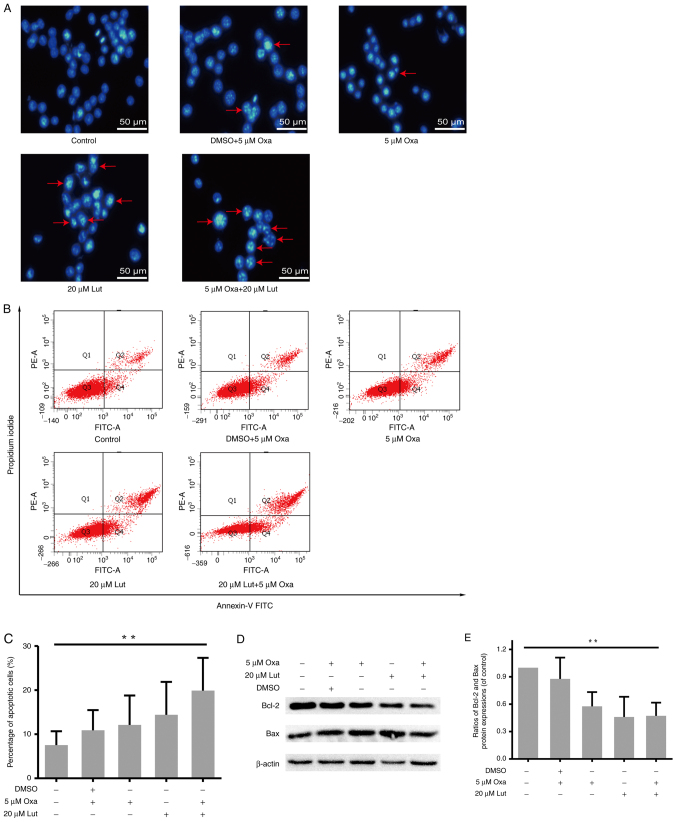
Figure 4.
MFC cell apoptosis induced by luteolin (20 µM) and/or oxaliplatin (5 µM). (A) The morphological changes indicative of MFC cell apoptosis were assessed by fluorescence inverted microscopy (magnification, ×200). (B and C) After double-staining with Annexin-V FITC and PI, flow cytometry was used for the quantitative analysis of MFC cell apoptosis. (D) Protein expression levels (Bcl-2, Bax, and β-actin) were assessed by western blot analysis. (E) Scanning gray analysis was calculated by Photoshop CC software (Adobe Systems Inc.). Data are presented as mean ± SD, **P<0.01. Experiments were repeated at least 3 times. MFC, mouse forestomach carcinoma; Lut, luteolin; Oxa, oxaliplatin; Bax, BCL-2-associated X protein; Bcl-2, B-cell lymphoma 2.

