Figure 2.
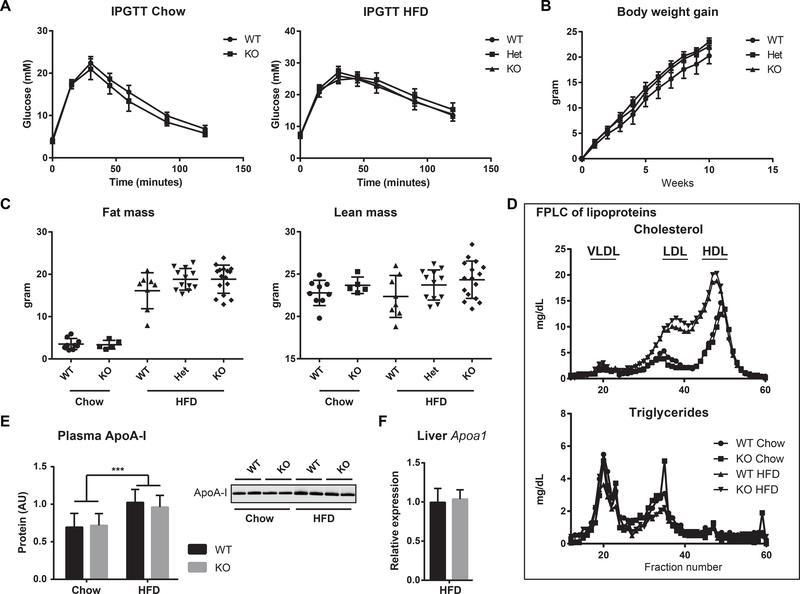
Metabolic studies in the Klf14 KO mouse. (A) IPGTT in mice on chow and HFD. Error bars in the IPGTT curves indicate SEM. (B) Weight gain of Klf14+/+, Klf14+/− and Klf14−/− mice after switching to a HFD. Error bars indicate SEM. (C) Fat and lean mass as measured by EchoMRI in mice on chow and HFD. The scatter dot plots include mean and SD. (D) FPLC separation of a pooled plasma sample for each cohort. All fractions were assayed for cholesterol and triglycerides. The position of the lipoproteins is indicated in the chromatogram. (E) ApoA-I protein levels in plasma and one representative immunoblot of plasma ApoA-I protein. Error bars indicate SD, group size is 6, *** P< 0.001. (F) Expression of Apoa1 normalized to 36B4 (Rplp0) in liver of Klf14+/+ (n=4) and Klf14−/− (n=3) mice on HFD. Error bars indicate SD.

