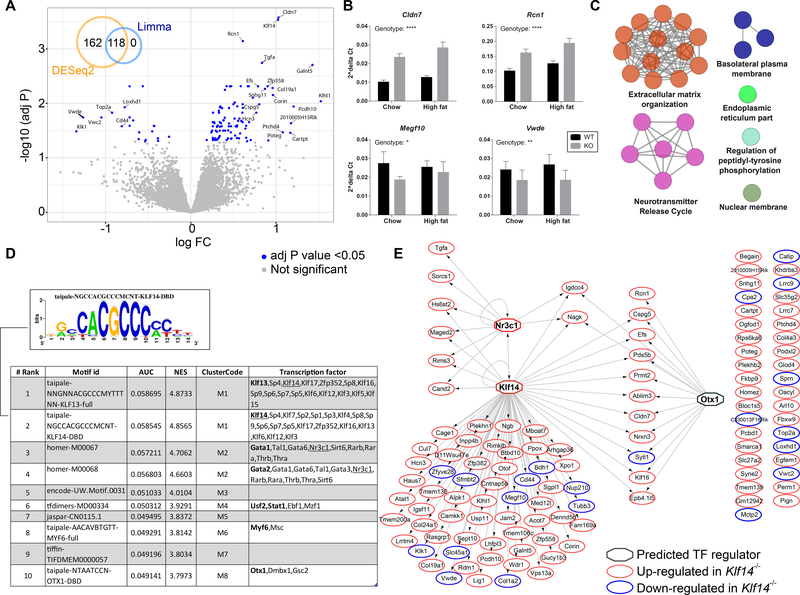
Figure 4.
RNA sequencing analysis of pituitary in the Klf14 KO mouse. (A) Volcano plot displaying the log2 fold change versus -log10 of the adj P value for all genes in the comparison of Klf14+/+ versus Klf14−/− in the pituitary of chow fed animals. The inset Venn diagram shows the overlap of genes detected as differentially expressed using either DESeq2 or limma packages. (B) qPCR validation of selected DEGs. Gene expression was calculated using the ΔCt method using Rplp0 as the reference gene. All 4 genes were significantly altered in a two-way ANOVA. The significance for the variation in genotype is indicated in the figure; **** P < 0.0001, ** P < 0.01, and * P < 0.05. (C) A network displaying pathways significantly enriched for the 118 DEGs in pituitary. The color of the node represents the pathway term grouping. All nodes are significantly enriched at an adj P value <0.05. (D) A table summarizing the results of the Iregulon analysis, which lists the top transcription binding motifs and their associated transcription factors found enriched in the cis-regulatory regions of the 118 DEGs. The underlined TFs are the more likely candidates based on the input data. (E) A network representing the predicted targets (as oval nodes) of the top potential transcriptional regulators (as octagonal nodes). The color of the oval nodes indicates whether that gene was up- or down-regulated in the pituitary of Klf14−/− mice when compared to Klf14+/+ mice.

