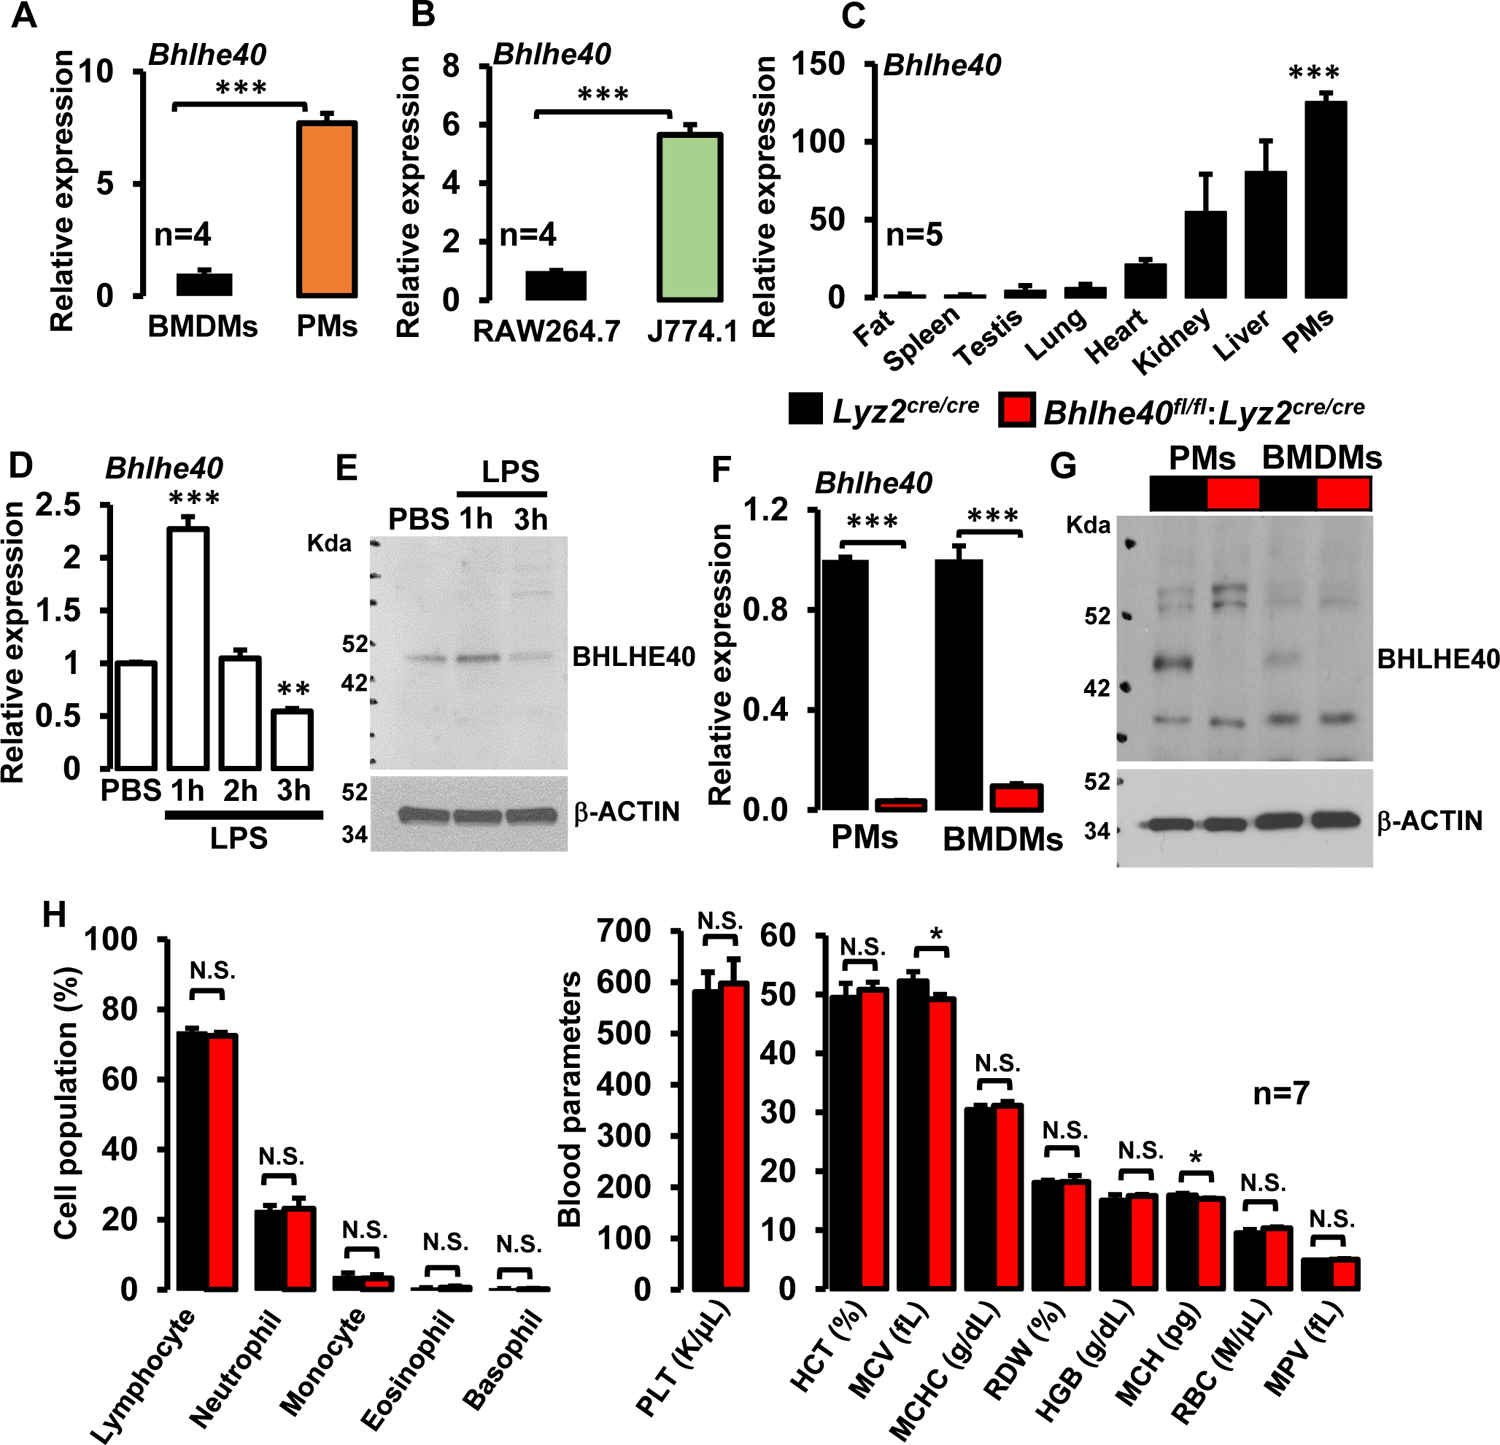
Figure 1. BHLHE40 expression and impact of myeloid-Bhlhe40 deficiency on blood cells.

(A and B) Bhlhe40 mRNA expression in bone marrow-derived macrophages (BMDMs), thioglycollate-elicited peritoneal macrophages (PMs), RAW264.7, and J774.1 cells were analyzed by RT-qPCR (n=4). (C) Bhlhe40 mRNA expression levels were analyzed in mouse adipose tissue, spleen, testis, lung, heart, kidney, liver, and PMs by RT-qPCR (n=5). (D and E) Wild-type murine BMDMs were stimulated with 100 ng/ml of LPS for 0–3 hours. BHLHE40 mRNA (D) and protein (E) expression were evaluated by quantitative PCR, and Western blot analyses, respectively (n=4). (F and G) PMs and BMDMs from Lyz2cre/cre and Bhlhe40fl/fl:Lyz2cre/cre mice were analyzed for BHLHE40 mRNA and protein expression by RT-qPCR (F) and Western blot (G) analyses respectively (n=5). Actin and 36B4 were used as housekeeping genes for western blot, and RT-qPCR analyses, respectively. (H) Age and sex-matched Lyz2cre/cre and Bhlhe40fl/fl:Lyz2cre/cre mice blood samples were analyzed by Hemavet 950™ hematology profiling unit. Bar graphs represent the mean cellular population with standard deviation (n=7). Data were analyzed either by Student’s t-test (A, B, F, H) or 2-way ANOVA (C and D). N.S. not significant. *P<0.05; **P<0.001, and ***P<0.001. All values are reported as mean ± S.D.
