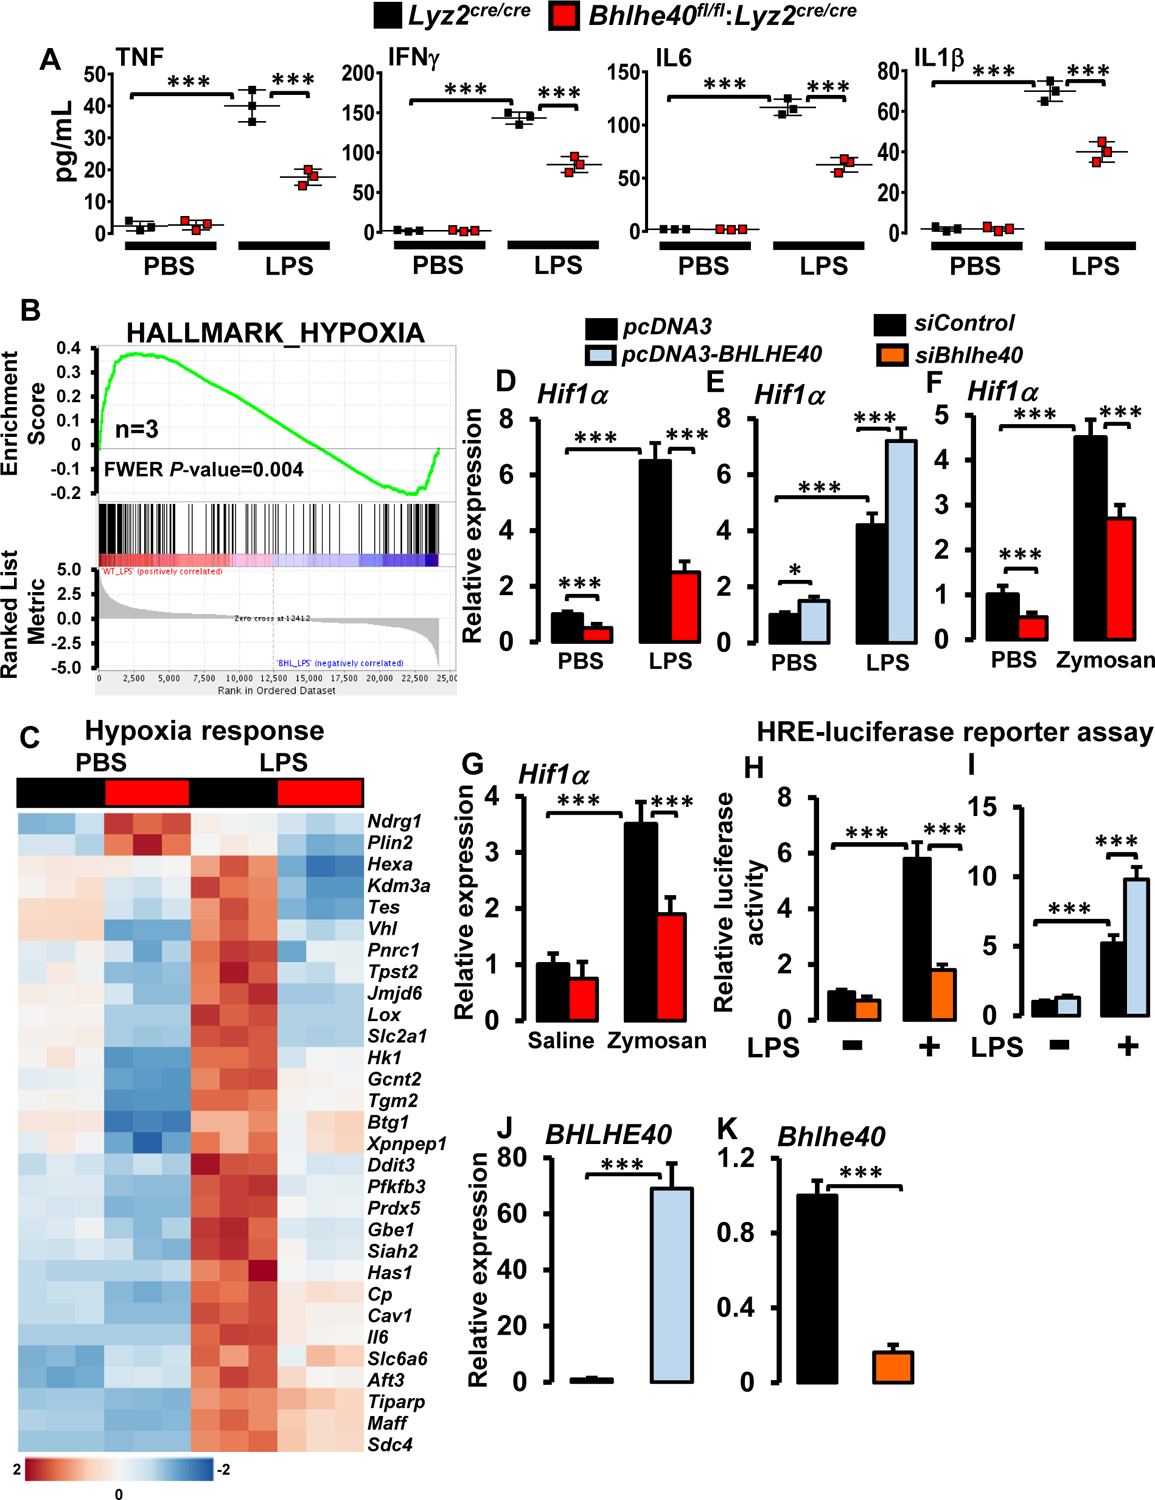
Figure 6. BHLHE40 promotes LPS-induced HIF1α expression in macrophages.

(A) Lyz2cre/cre and Bhlhe40fl/fl:Lyz2cre/cre mice PMs were stimulated with 100 ng/ml of LPS for 12 hours. Cell culture supernatant TNF, IFNγ, IL6, and IL1β levels were quantified by ELISA and normalized to total cell numbers (n=3). (B and C) Enrichment plot of hypoxia gene set obtained by GSEA (B) and heatmap showing clustering of hypoxia response genes (C) generated by comparing RNAseq data from Lyz2cre/cre and Bhlhe40fl/fl:Lyz2cre/cre mice PMs following LPS treatment (n=3). (D and E) Lyz2cre/cre and Bhlhe40fl/fl:Lyz2cre/cre mice PMs (D) or RAW264.7 cells transfected with pcDNA3-BHLHE40 (E) were stimulated with 100 ng/ml LPS for 4 hours. Total RNA samples were analyzed for Hif1α expression by RT-qPCR (n=4). (F) Lyz2cre/cre and Bhlhe40fl/fl:Lyz2cre/cre mice PMs were stimulated 0.2μg/ml zymosan for 4 hours. Total RNA samples were analyzed for Hif1α expression by RT-qPCR (n=3). (G) The Lyz2cre/cre and Bhlhe40fl/fl:Lyz2cre/cre mice were challenged with intratracheal delivery of saline or zymosan. Macrophages derived from bronchoalveolar lavages were evaluated for Hif1α expression by RT-qPCR (n=5). (H and I) RAW264.7 cells were transfected with an HRE-luciferase reporter construct in the presence of Bhlhe40-specific siRNA (H) or pcDNA3-BHLHE40 plasmid (I). These cells were stimulated with 100 ng/ml LPS for 18 hours, and cell lysates were analyzed for luciferase activity (n=3). (J and K) RAW264.7 cells transfected with pcDNA3-BHLHE40 (J) or BHLHE40 specific siRNA (K). Total RNA samples were obtained and evaluated for BHLHE40 expression by RT-qPCR (n=3). 36B4 or SHDA were used as housekeeping genes for RT-qPCR analyses. Values are reported as mean ± SD. Data were analyzed by ANOVA followed by Bonferroni post-testing. ***p < 0.001.
