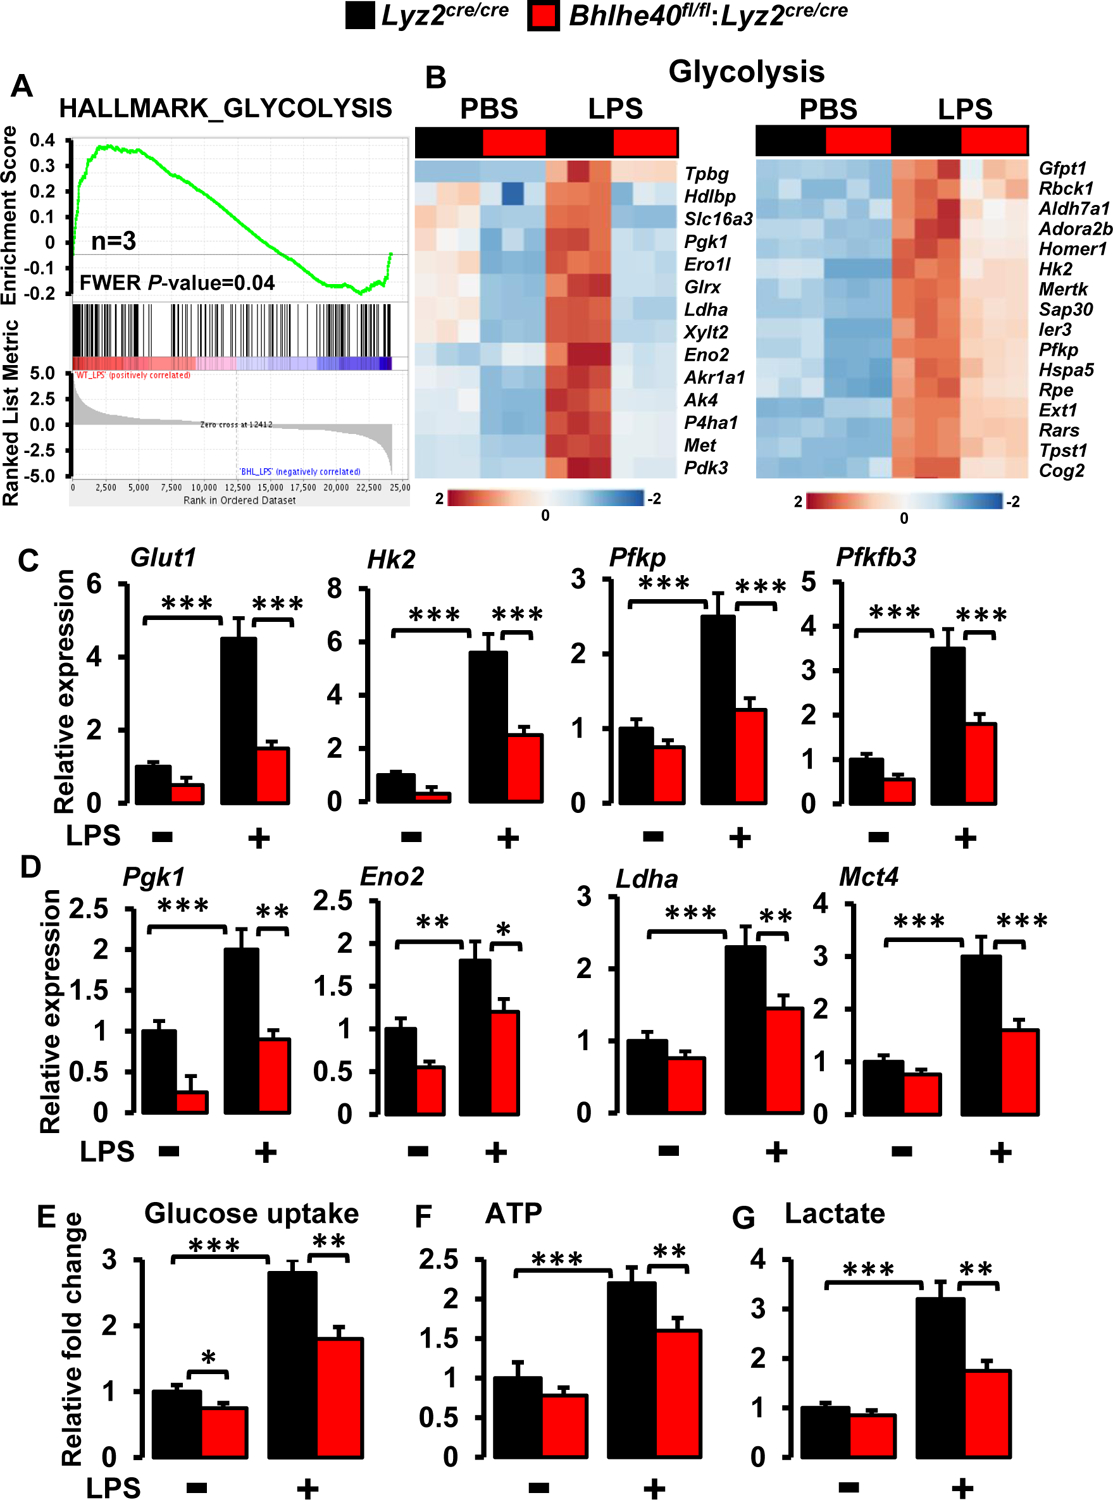
Figure 8. BHLHE40 deficiency attenuates the process of glycolysis in macrophages.

(A and B) Enrichment plot of glycolysis gene set obtained by GSEA (A) and heatmap showing clustering of glycolysis genes (B) generated by comparing RNAseq data from Lyz2cre/cre and Bhlhe40fl/fl:Lyz2cre/cre mice PMs following LPS treatment (n=3). (C and D) Lyz2cre/cre and Bhlhe40fl/fl:Lyz2cre/cre mice PMs were stimulated with 100 ng/ml LPS for 4 hours. Total RNA from these experiments were evaluated for the expression of Glut1, Hk2, Pfkp, Pfkfb3 (C), and Pgk1, Eno2, Ldha, Mct4 (D) expression by RT-qPCR (n=4). 36B4 was used as a housekeeping gene for RT-qPCR analysis. (E-G) Lyz2cre/cre and Bhlhe40fl/fl:Lyz2cre/cre mice PMs were stimulated with 100ng/ml LPS. These cells were evaluated glucose uptake (E), ATP generation (F), and extracellular lactate production (G) by commercially available assay kits (n=3). Values are reported as mean ± SD. Data were analyzed by ANOVA followed by Bonferroni post-testing. *p < 0.05, ** p< 0.01 and ***p < 0.001.
