Fig. 3.
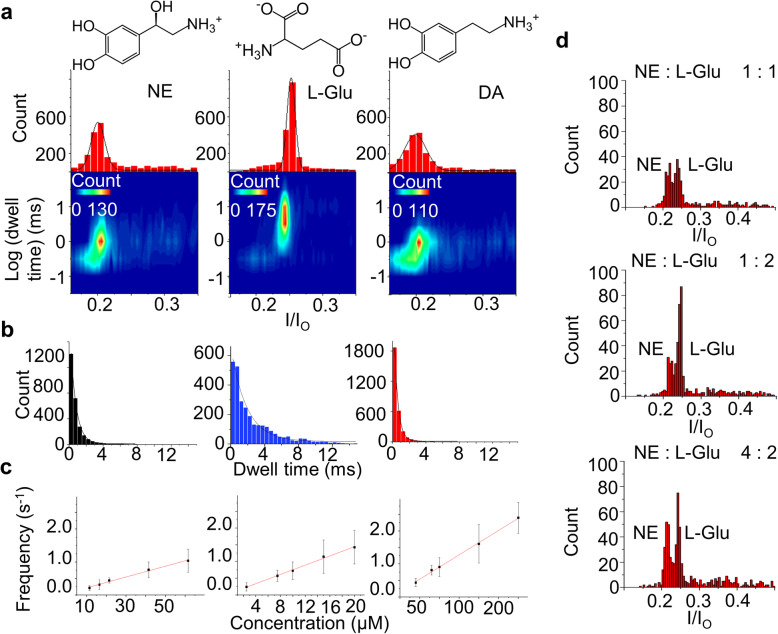
Detection of NE, L-Glu, DA by the M2MspA-N91H nanopore. a 2D contour plots of blockade percentage versus log (dwell time) and blockade percentage histograms of NE, L-Glu and DA from left to right, concentrations: NE, 100 μM; L-Glu, 20 μM; DA, 100 μM. b Event duration histograms of NE, L-Glu and DA fitted to exponential decay curves. c Concentration gradient experiments, showing first order dependence of event frequency on concentration of NE, L-Glu and DA (linear fit, R2 = 0.990, 0.995, 0.997). d Blockade percentage histograms of NE and L-Glu mix with ratio of 25 μM: 25 μM (1: 1), 25 μM: 50 μM (1: 2) and 100 μM: 50 μM (4: 2) in 50 s. (1 M KCl, pH 7.5, 298 K, + 50 mV). All the experiments were repeated at least 3 times

