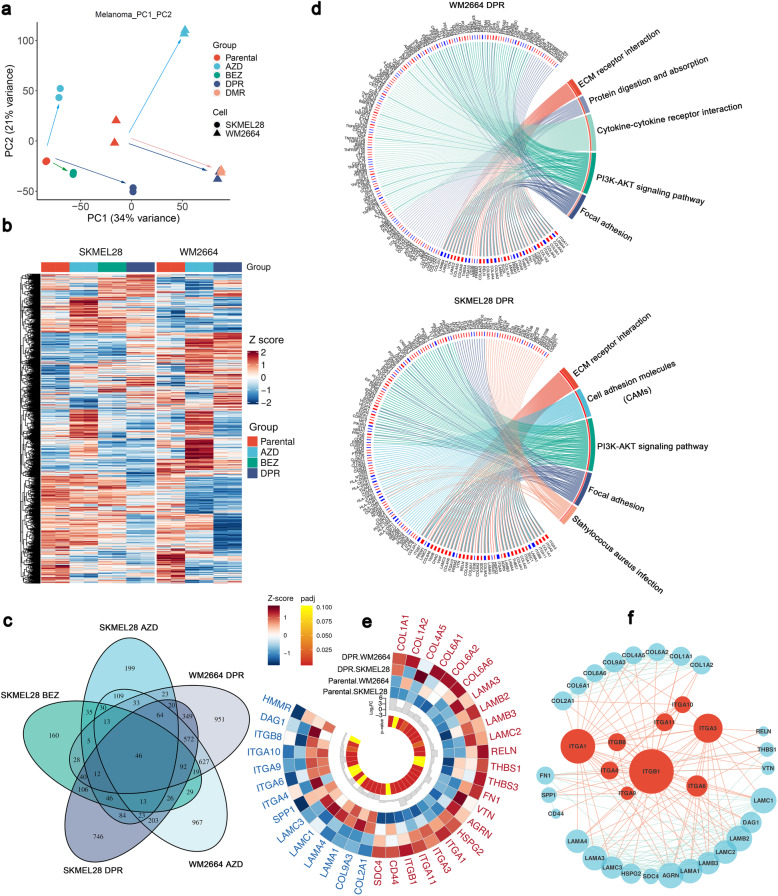
Fig. 3.
Transcriptome profiling suggested that ECM receptor pathways were enrichment in resistant cell lines. a PCA analysis of RNA-seq profiles in WM2664 and SKMEL28 parental, DPRs, and single drug resistance (SDR). Each dot represents one sample. b Heat map of all expressed genes in SKMEL28 and WM2664 DPR, SDR, and parental cell lines. Gene-expression variant was calculated by Z-score. c Venn diagram of differential expression genes (DEGs) in all resistant cell lines. d KEGG enrichment analysis of DEGs in DPR resistant cell lines (p < 0.05, top 5). e Expression profile of DEGs in the ECM pathway of WM2664 DPR or SKMEL28 DPR, colors of outer circles present z-score of gene expression, and colors of inter circle means p-value of Wald statistical test between DPR resistance and Parental cell groups. f STRING analysis identified the interaction of differential proteins in the ECM pathway; the size of points indicates the node degree of genes

