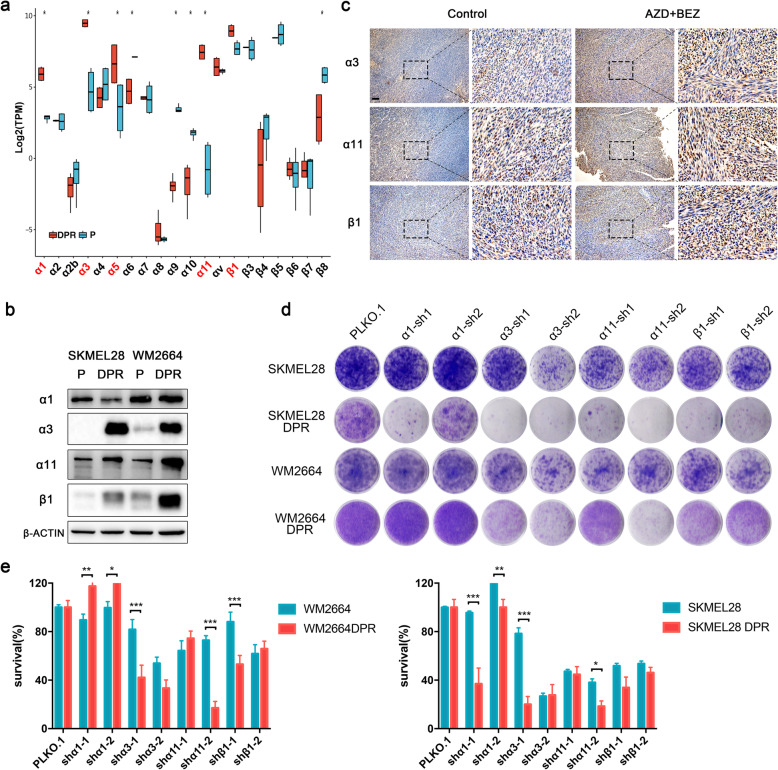
Fig. 4.
Transcriptome profiling suggested that ECM receptor pathways were enrichment in resistant cell lines. a mRNA expression of integrins in SKMEL28 and WM2664 parental and DPRs. Significance was determined by Wilcoxon signed-rank test, ∗p < 0.05. b Western blot showing protein levels of integrins α1, α3, α11 and β1 in WM2664 and SKMEL28 parental and DPRs. c Representative images of IHC analysis with integrin α3, α11 and β1 in tumors grown with or without dual inhibitors (scale bar = 100 μm). Image is representative of five independent experiments. d Clonogenic assays of parental and DPRs engineered control (vector) or integrins-targeting shRNAs. Results are shown for one representative of three independent experiments. e Quantification of (d), ∗p < 0.05, ∗∗p < 0.01, or ∗∗∗p < 0.001

