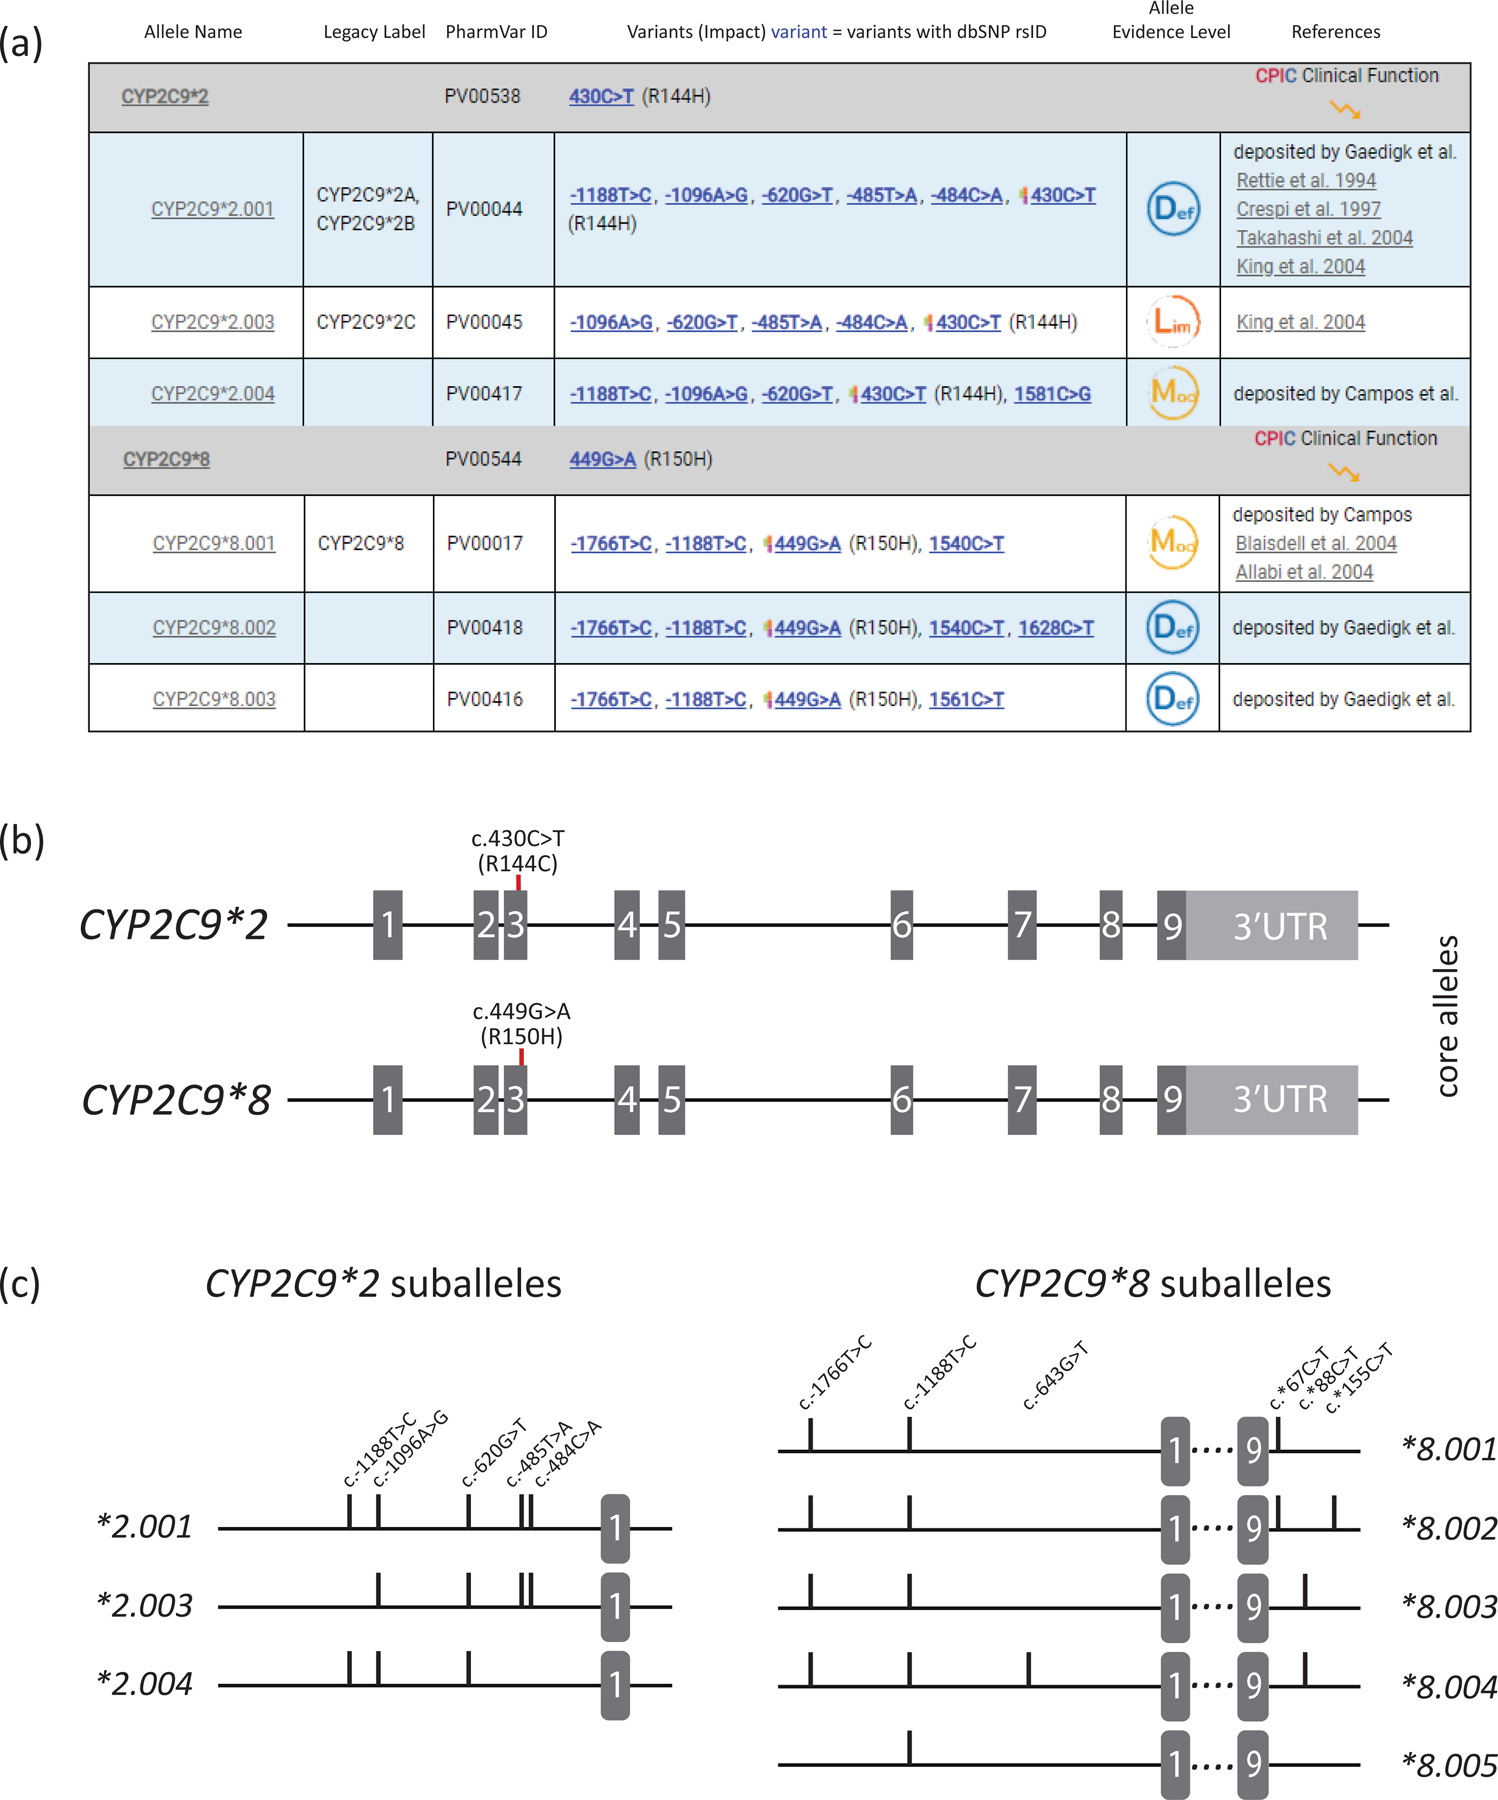
Figure 3. Overview of core allele and suballele categorization.

Panel (a) shows the CYP2C9*2 and *8 core allele definitions (gray bar) with NM_000771.4 as the reference sequence. Core SNVs, PharmVar ID (PVID), and evidence level is shown for each allele. All currently defined CYP2C9*2 suballeles and selected CYP2C9*8 suballeles are displayed underneath the core allele bar. Legacy allele designations are cross-referenced (e.g., *2.001 corresponds to *2A and *2B which have been merged). Panel (b) is a graphical representation of the CYP2C9*2 and *8 core alleles. Each is characterized by a single core SNV is highlighted in red (CYP2C9*2 by c.430C>T, p.R144C and CYP2C9*8 by c.449G>A, R150H). While c.449G>A is unique to CYP2C9*8, c.430C>T is not only found in the CYP2C9*2 haplotype (see Figure 2 for more details). Gray boxes represent the nine exons (scale is approximated); 3’UTR denotes the 3’ untranslated region. Panel (c) shows the CYP2C9*2 and *8 suballeles defined to date. As shown, suballeles of CYP2C9*2 only differ in their upstream region (graph only shows this portion of the gene), while those for CYP2C9*8 also vary in their 3’UTR regions (graph showing respective regions). ‘Lim’, ‘Mod’ and ‘Def’ symbols denote ‘Limited’, ‘Moderate’ and ‘Definitive’ haplotype evidence levels.
