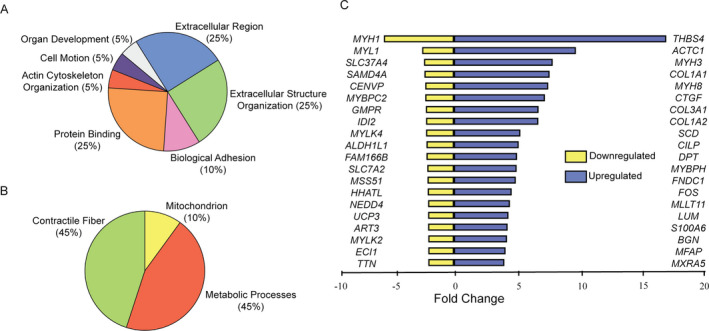
Figure 3.

Gene Ontology functional categories most represented among the upregulated genes (A) and the downregulated genes (B) in COL6‐RD skeletal muscle biopsies. (C) A list of top 20 individual upregulated and downregulated genes. The scale represents the linear fold change.
