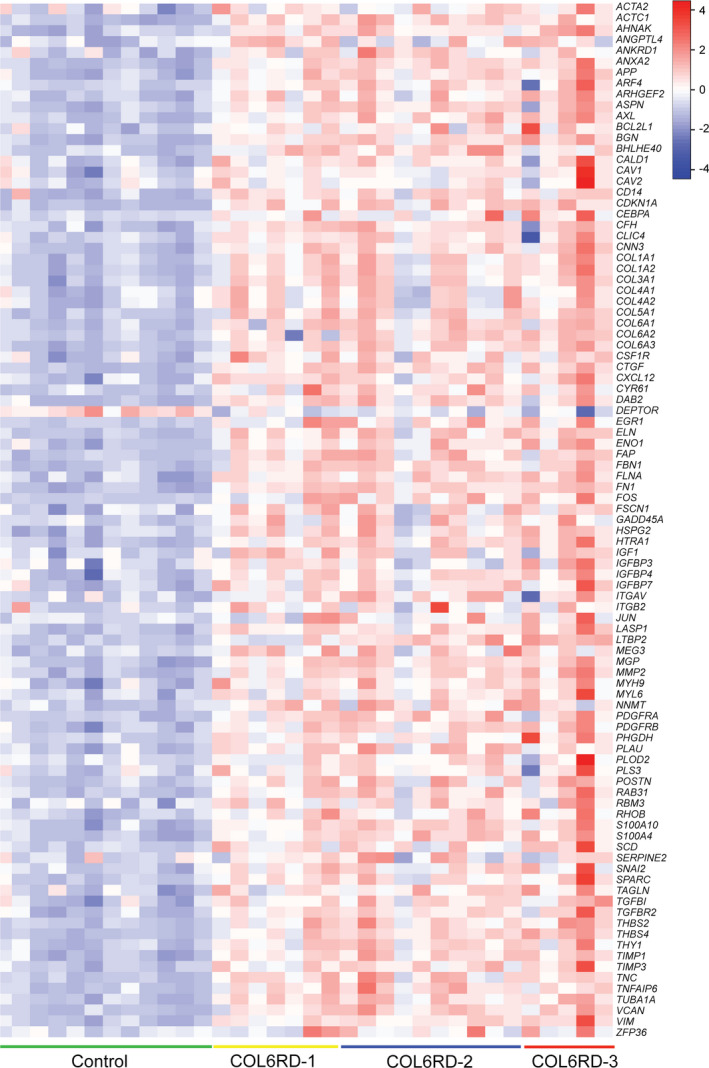
Figure 4.

Expression levels of 95 TGFβ‐related genes in the RNAseq dataset are depicted in a heatmap format using row Z‐scores derived from Log2(RPKM + 2) for each sample. Nearly all of these selected genes, with rare exceptions (e.g., DEPTOR), are upregulated in the COL6‐RD samples.
