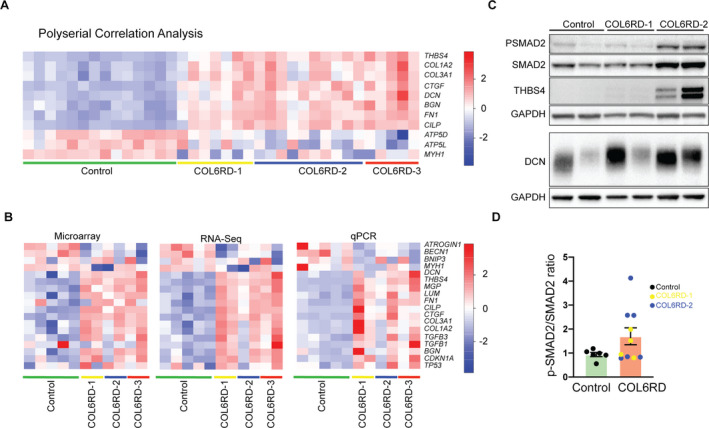
Figure 5.

(A) Expression level of selected genes identified by polyserial correlation analysis. Expression levels are depicted in a heatmap format using row Z‐scores derived from Log2(RPKM + 2) for each gene. RPKM = Reads per kilobase of transcript per million (B) Technical validation of microarray and RNA‐Seq data by qPCR on 17 genes performed on a randomly selected subset of controls (n = 5) COL6‐RD (n = 6, two from each histologic severity group) muscle biopsies. The relative expression levels are plotted in a heatmap using row Z‐scores: microarray and RNA‐Seq: Log2(RPKM + 2), qPCR: linear fold change normalized to a control sample). (C) Representative western blot of human muscle biopsy lysates for detection of P‐SMAD2, SMAD2, thrombospondin‐4 (THBS4), and decorin (DCN). (D) Densitometry of p‐SMAD2/SMAD2 ratio in control (n = 6) and COL6‐RD (n = 10) skeletal muscle samples normalized to control samples in each group of analysis. P‐SMAD2/SMAD2 ratio trends higher in COL6‐RD samples with a high degree of variability.
