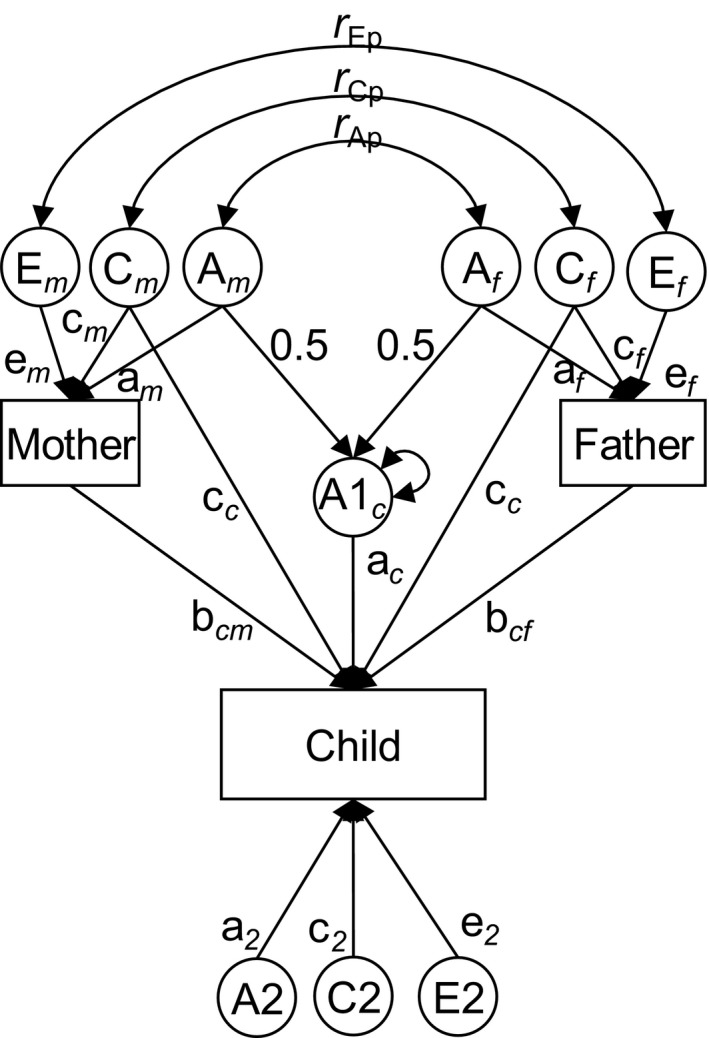
Figure 1.

Partial path diagram of the extended children‐of‐twins model. The illustration shows only one parent–child trio, whereas the model fitting included twins and siblings in the parent generation and up to two children per nuclear family. A = additive genetic factors; C = shared (family) environmental factor; E = individual‐specific environmental factors
