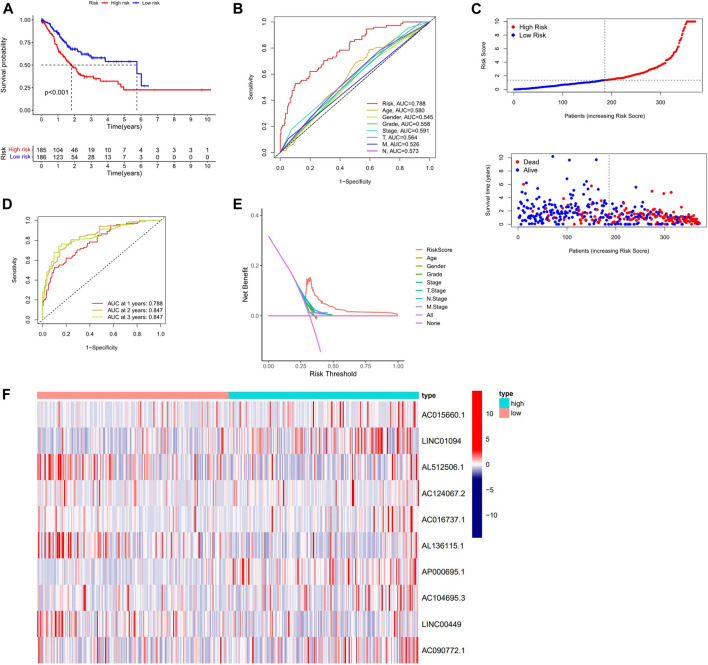
FIGURE 3.
Validation of the Inflammation-related lncRNAs signature. (A) Survival curves result, (B). The AUC values for forecasting OS based on risk factors, (C). Risk score distribution and survival status of GC patients, (D) AUC of time-dependent ROC curves represented of 1, 2, 3-years survival rates of GC and risk score (E) The DCA plot. (F) Expression profile heatmap of the 10 inflammation-related lncRNAs signature.

