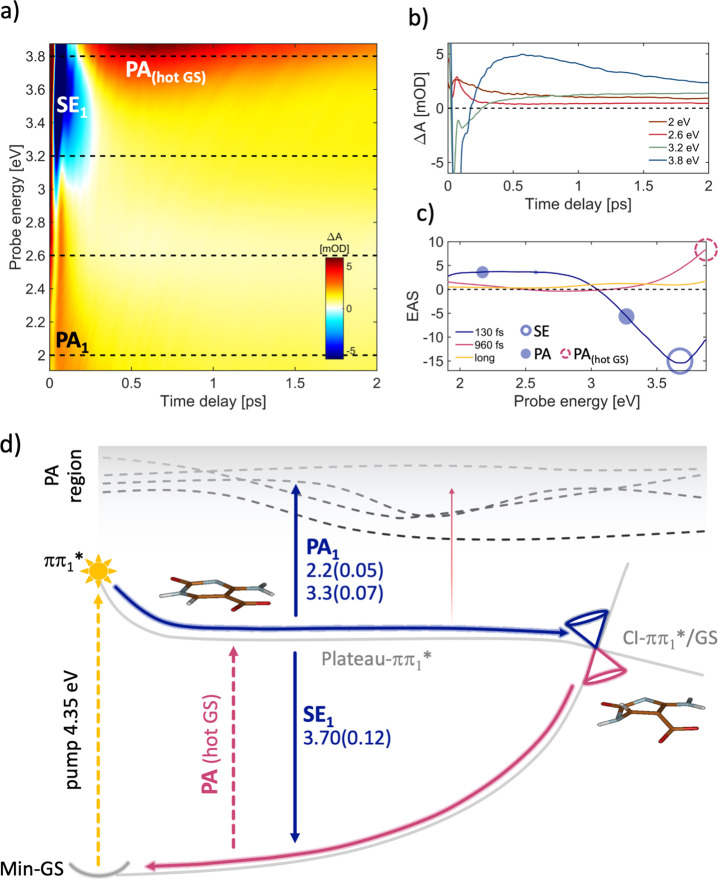
Figure 4.
(a) ΔA map of cadC in water solution recorded with parallel pulse polarizations. (b) Dynamics at selected probe energies (eV) marked with dashed lines on panel a. (c) EAS with the corresponding time constants: 130 fs (blue curve) is the time needed to ballistically relax from the FC to the ππ1*/GS CI (see calculated blue paths in panel d), and 960 fs pink curve signals correspond to the hot GS repopulation, following the ultrafast IC (calculated decay path in panel d). The yellow line corresponds to long-lived products probably due to other minor decay paths. Empty and full circles correspond to the calculated SE and PA energy values, respectively, and the circle dimensions are proportional to the computed OS values (documented in panel d). (d) Schematic decay paths of cadC, calculated at CASPT2/MM level (details in the SI section). Relaxation routes and SE/PA colors arrows are matching with the line colors of time constants in panel c. Oscillator strengths are reported in brackets. Critical point energies are in Figure S10. Molecular optimized structures refer to the QM region only.

