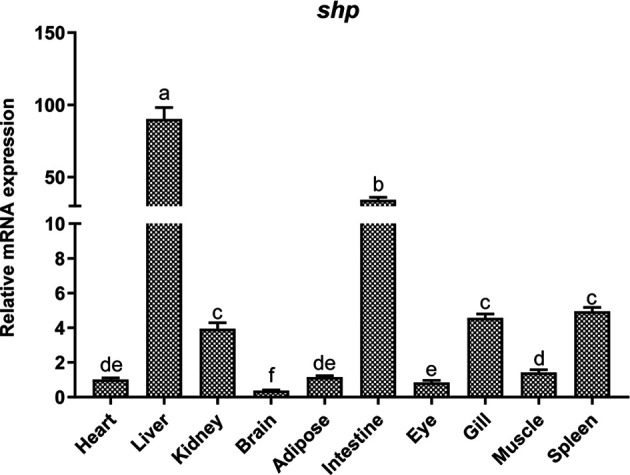
Figure 4.

Tissue distribution of SHP in large yellow croakers. Data are presented as means ± SEMs, n = 3 replicate experiments. Significance was evaluated by one-factor ANOVA followed by Duncan’s multiple range test. Labeled means without a common letter differ, P < 0.05.
