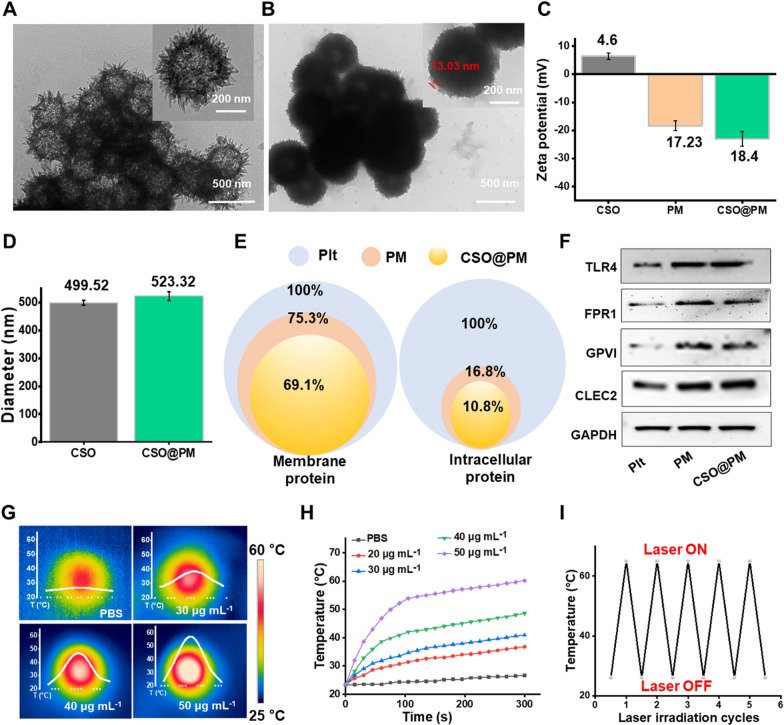
Fig. 2.
Characterization of CSO@PM. Representative TEM images showing the morphologies of CSO A before and B after PM coating. C Zeta potential values for CSO, PM, and CSO@PM. Data are mean ± SD (n = 3). D Hydrodynamic diameters of CSO and CSO@PM. Data are mean ± SD (n = 3). E Preservation of the PM proteins and E intracellular proteins detected in platelets, PM, and CSO@PM using proteomic analysis. F Western blot analysis of TLR4, FRP1, GPVI, GLEC-2, and GAPDH in platelets, PM, and CSO@PM. G Corresponding thermographic images and H temperature evolution curves of CSO suspensions with different concentrations in PBS (pH 7.4) under 808 nm NIR laser irradiation at 1.5 W cm−2. I Thermal response of CSO under repeated laser irradiation (n = 5; 808 nm, 1.5 W cm–2)

