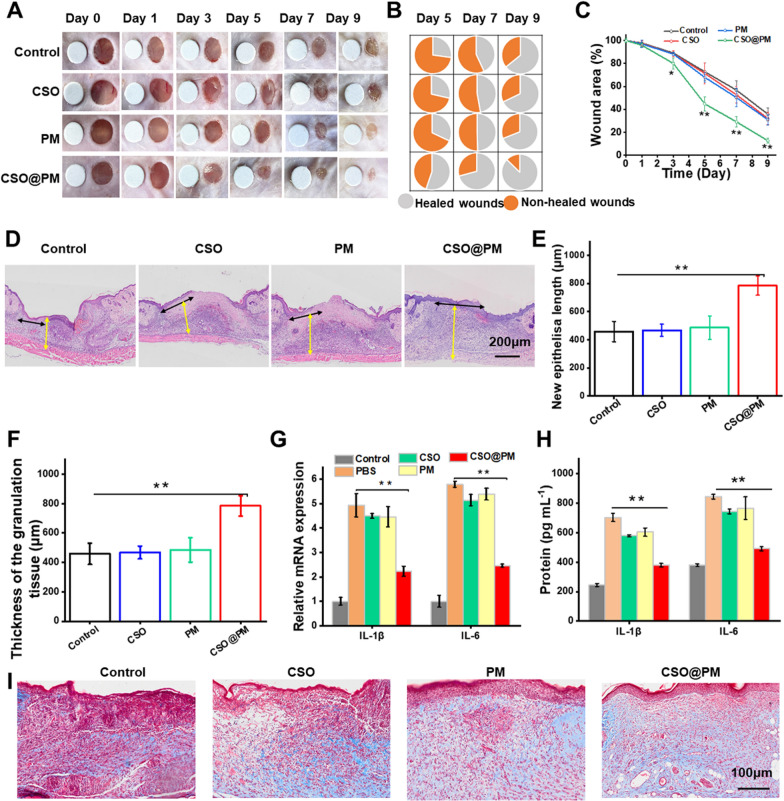
Fig. 6.
Effect of CSO@PM on LPS-infected wound healing. A Photographs of LPS-infected wounds under different treatments. The round blue card with a 5 mm diameter indicates initial wound size. B Fractions of the wounds healed by the different treatments on days 5, 7, and 9 (n = 3). C Quantitative wound area analysis for each group (n = 3). * P < 0.1 and ** P < 0.001 compared to the corresponding control group. D H&E images of mouse wound tissue from all groups at day 7. Black arrows indicate the length of newly regenerated epidermis. Yellow arrows indicate thickness of granulation tissue. Scale bar: 200 μm E Neo-epidermis length and F granulation tissue thickness data. G Real-time quantitative PCR detection results for IL-1β and IL-6 mRNA and H protein expression of IL-1β and IL-6 in LPS-infected wounds at day 7. The values are shown as mean ± SD (n = 3). * P < 0.1 and ** P < 0.001 compared to the corresponding control group. I Masson images of mouse wound tissue from all groups on day 7. Scale bar: 100 μm

