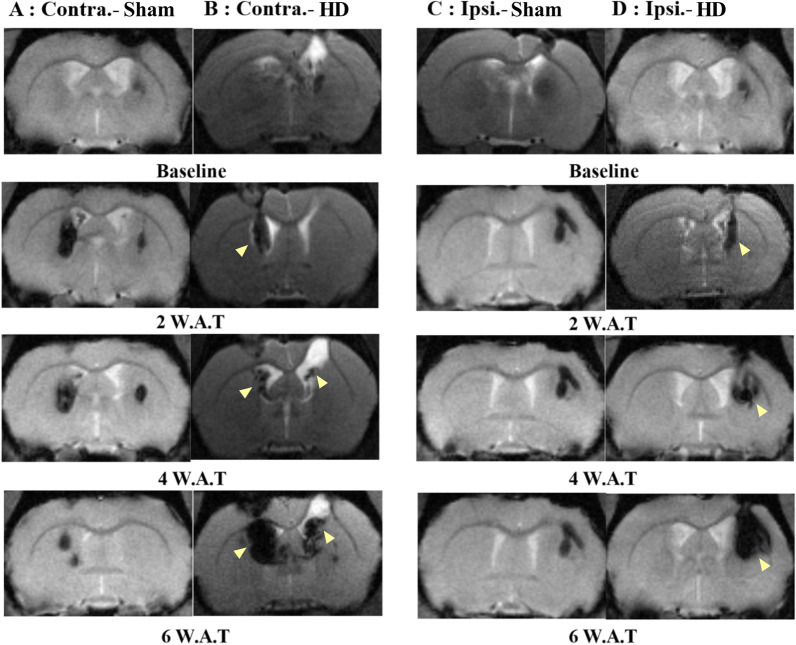
Fig. 4.
MRI tracking of SPION labeled embryonic stem cells. A MRI images of the Sham-contra-hESC group showed a reduction of low signal intensity area in the striatum as time passes and detection of the area in another side of the brain. B MRI images of the HD-contra-hESC group showed expansion and migration (yellow arrow) of the low signal intensity area in the striatum as time passes and detection of hESCs in the other side of the brain. C MRI images of the Sham-ipsi-hESC group showed no changes of low signal intensity area in the striatum as time passes. D MRI images of the HD-ipsi-hESC group showed expansion and migration (yellow arrow) of low signal intensity area in the striatum as time passes

