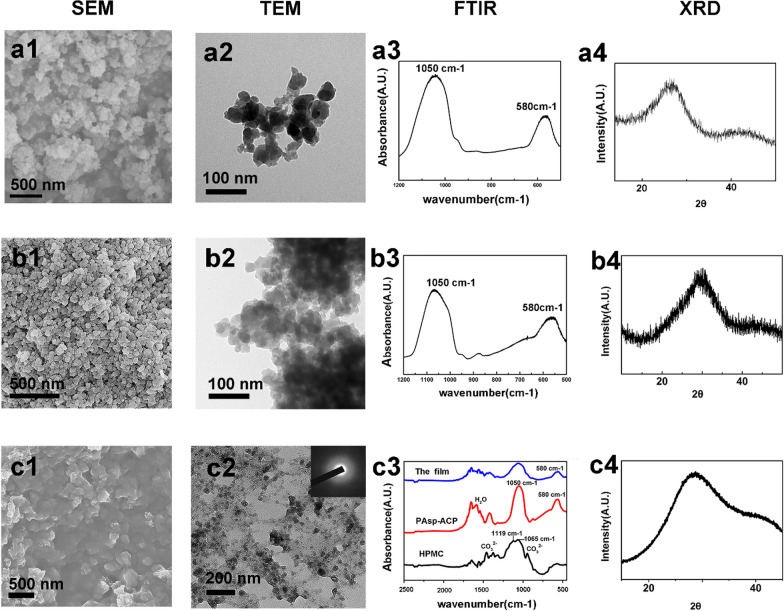
Fig. 2.
Characterization of ACP (a1–a4), PAsp-ACP nanoparticles (b1–b4) and the mineralizing film (c1–c4). a1, b1 SEM images of ACP and PAsp nanoparticles show the particles were spherical. a2, b2 TEM images of ACP and PAsp nanoparticles show the diameter of an individual nanoparticle is approximately 30–80 nm. a3, b3 FTIR spectra of ACP and PAsp nanoparticles shows characteristic amorphous peaks at 1050 cm−1 and 580 cm−1. a4, b4 XRD patterns of the ACP and PAsp-ACP nanoparticles show the broad peak, the peak in a4 is a small left offset compared to that of b4 and c4. c1 SEM image shows that the PAsp-ACP nanoparticles are homogeneously distributed in the mineralizing film. c2 TEM image shows that the spherical PAsp-ACP nanoparticles are dispersed in HPMC, and the SAED pattern (inset panel) indicates that the PAsp-ACP nanoparticles are amorphous. c3 FTIR spectra shows that HPMC exhibits a typical C–O peak at 1065 cm−1, C–O–C peak at 1119 cm−1, and CO32− peaks at 872 cm−1 and 1420 cm−1 (black line). The PAsp-ACP nanoparticles exhibit characteristic PO43− absorption peaks at 1050 cm−1 and 580 cm−1 as well as absorption peaks attributed to bound water at 1300 cm−1 and 1750 cm−1 (red line). The mineralizing film exhibits characteristic peaks of both HPMC and the ACP nanoparticles (blue line). c4 The XRD pattern of the mineralizing film displays a broad peak at 2θ = 30°

