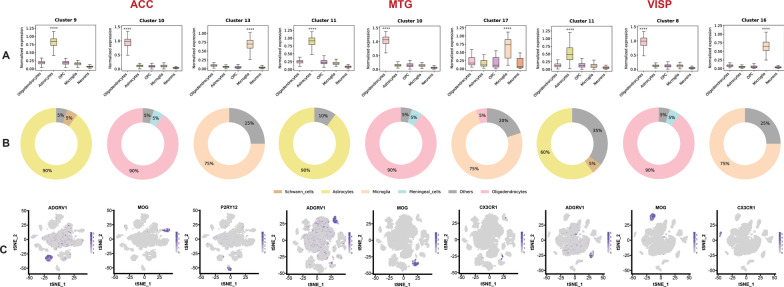
Fig. 3.
Expression of known marker genes in clusters of 3 brain regions, ACC (anterior cingulate cortex), MTG (middle temporal gyrus) and VISp (primary visual cortex). A Boxplot representing the average expression of cluster genes related to specific cell types (known marker genes); box plots showing median, interquartile range (IQR) with whiskers adding IQR to the 1st and 3rd quartile. Y-axis represents normalised gene expression, x-axis represents known marker genes of brain cell types, oligodendrocytes, astrocytes, OPC, microglia and neurons. B Donut plot displaying the composition of top 20 DE genes in comparison to known marker gene list (yellow-astrocytes, orange-microglia, pink-oligodendrocytes, grey-others). C Feature plot to visualise the expression of known marker gene related to specific cell types on tSNE plot. Expression of astrocytes (ADGRV1), oligodendrocytes (MOG) and microglia (P2RY12/ CX3CR1) across different clusters are also shown

