Figure 3.
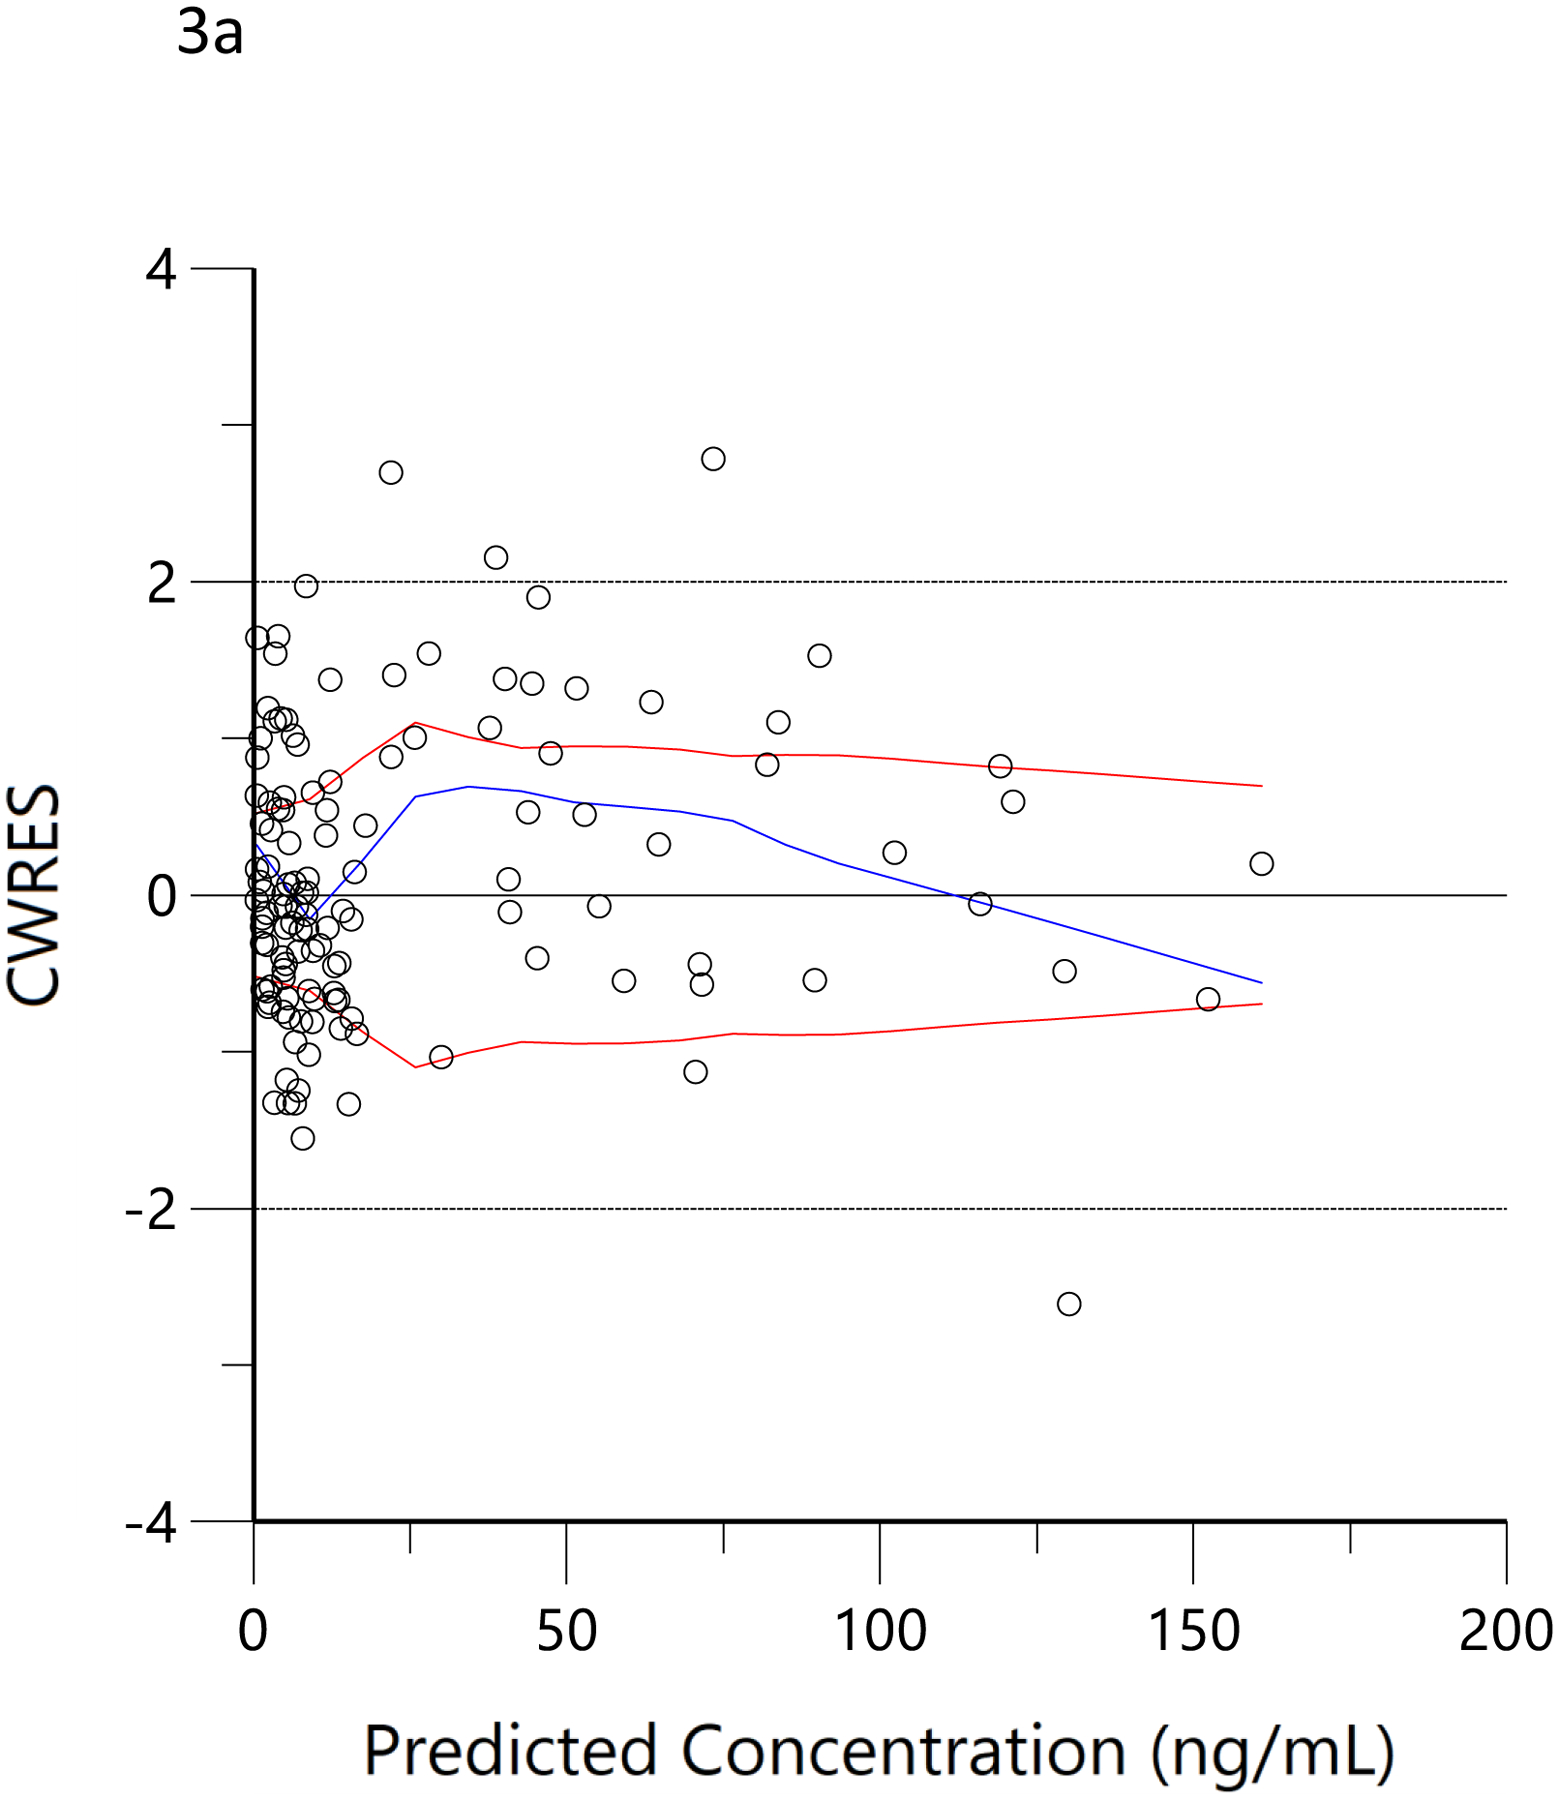
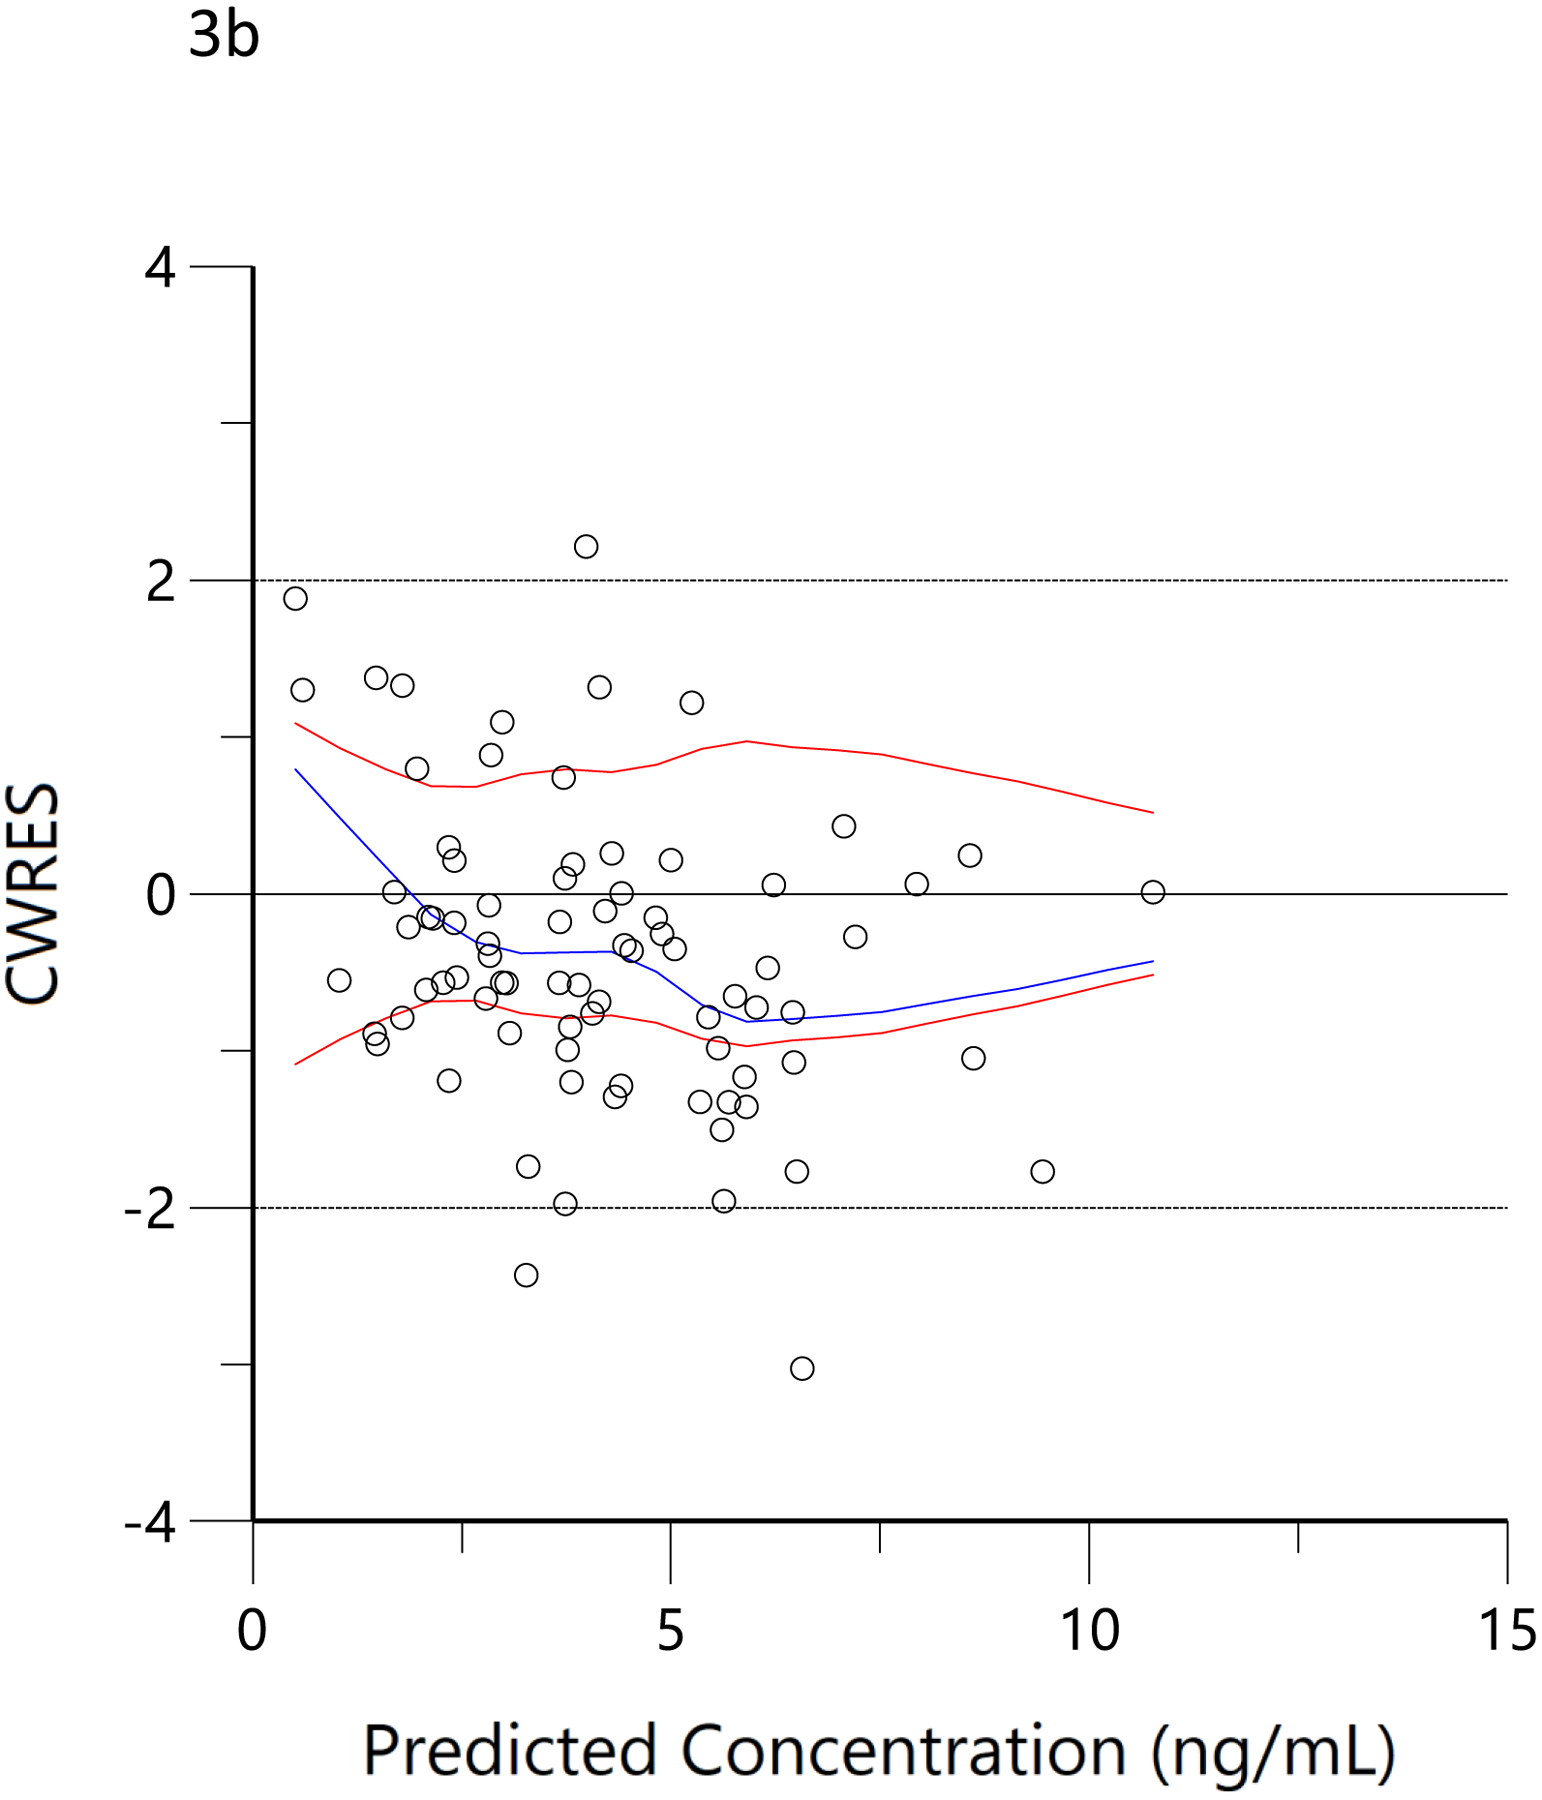
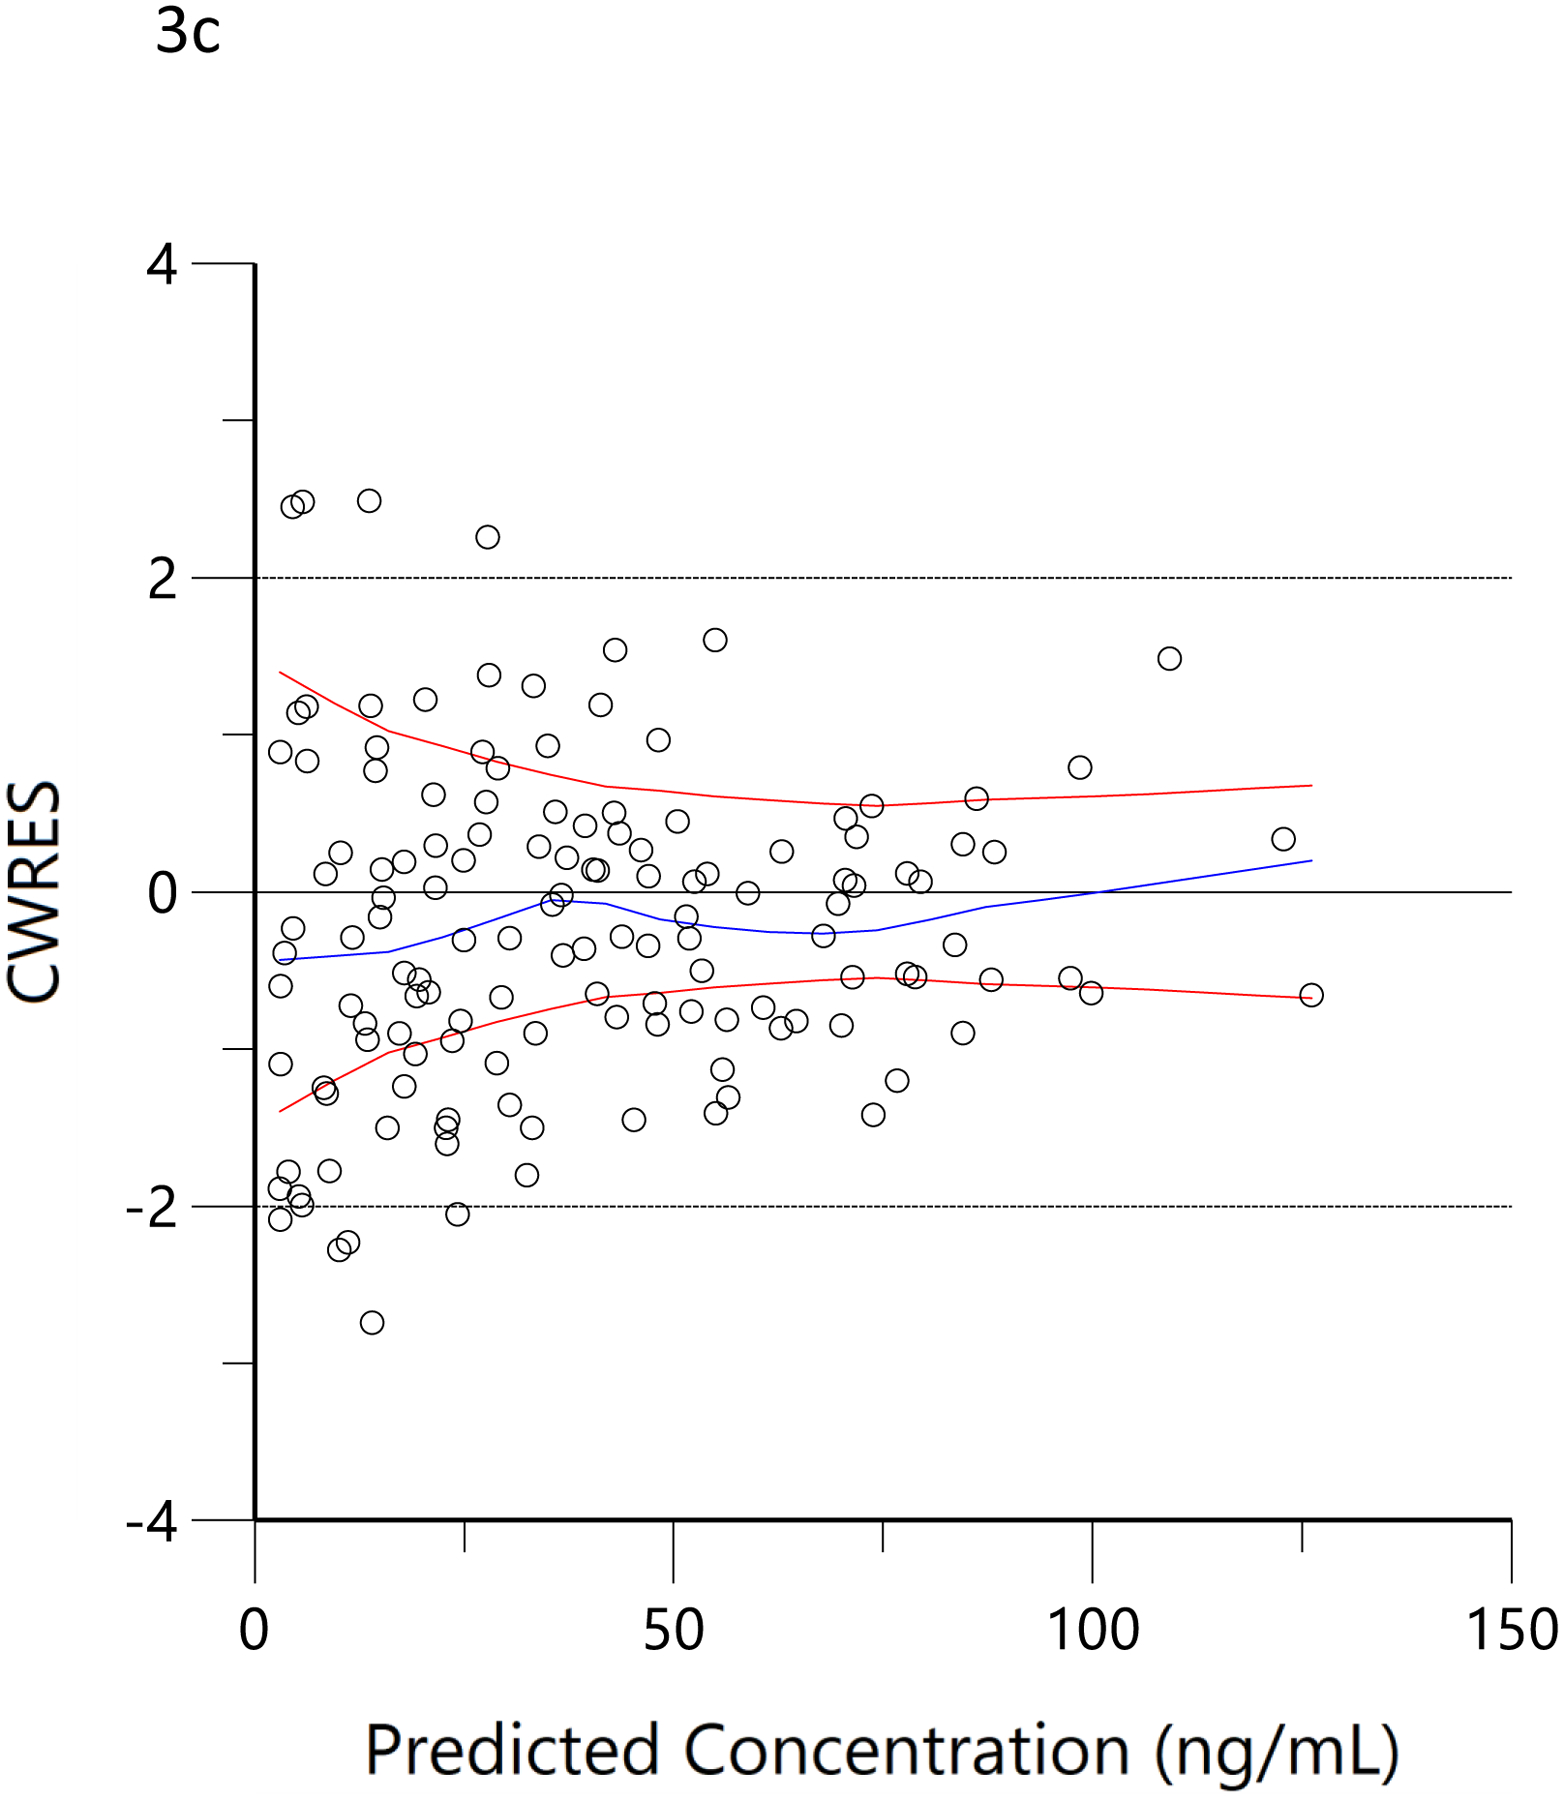
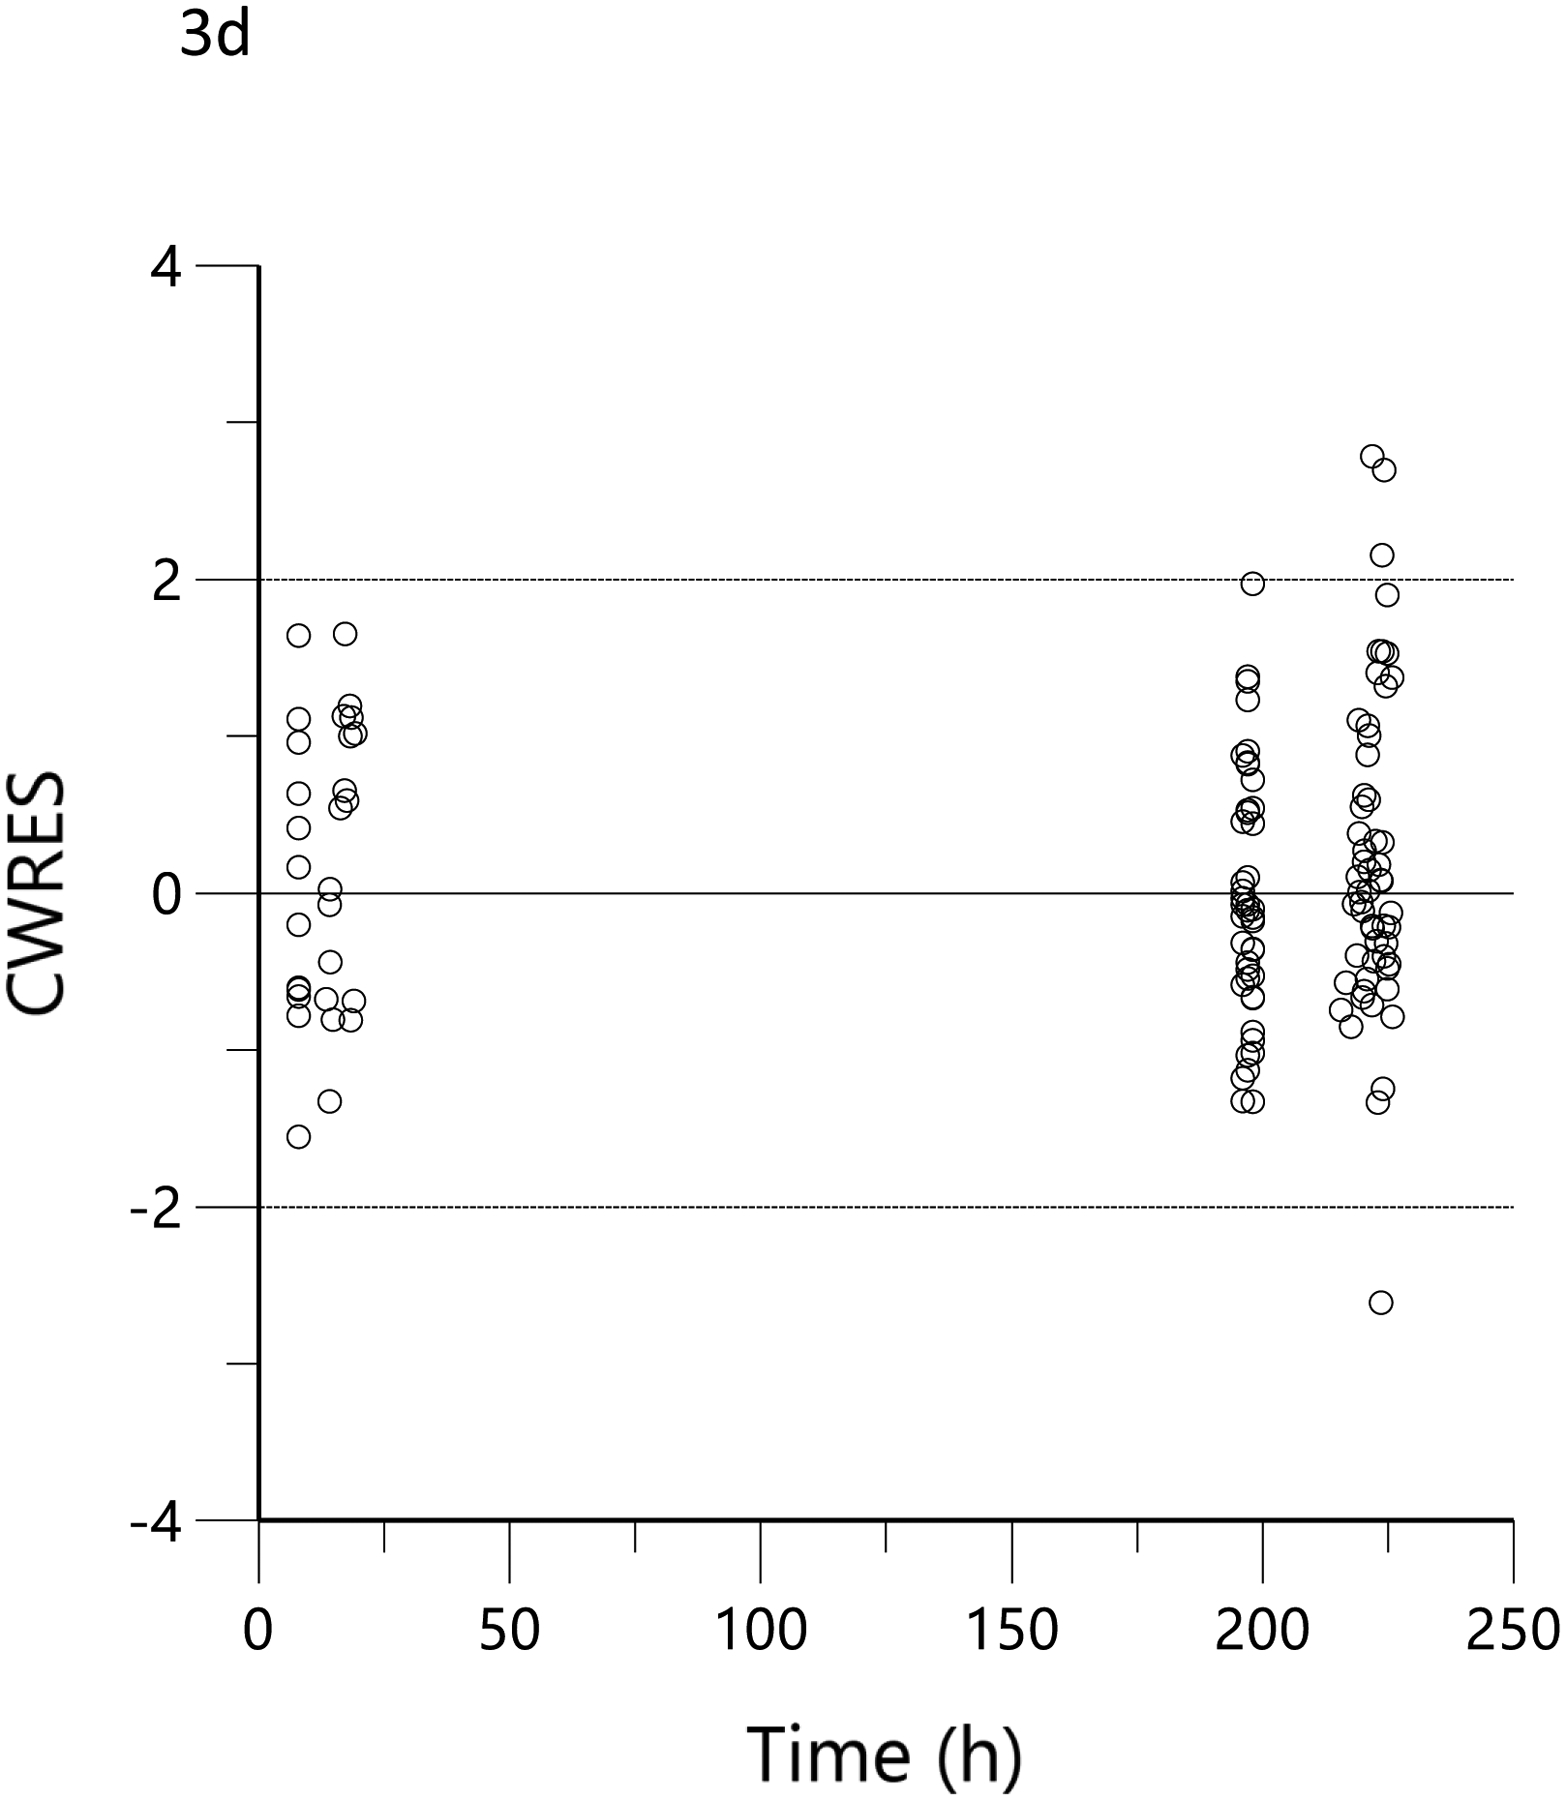
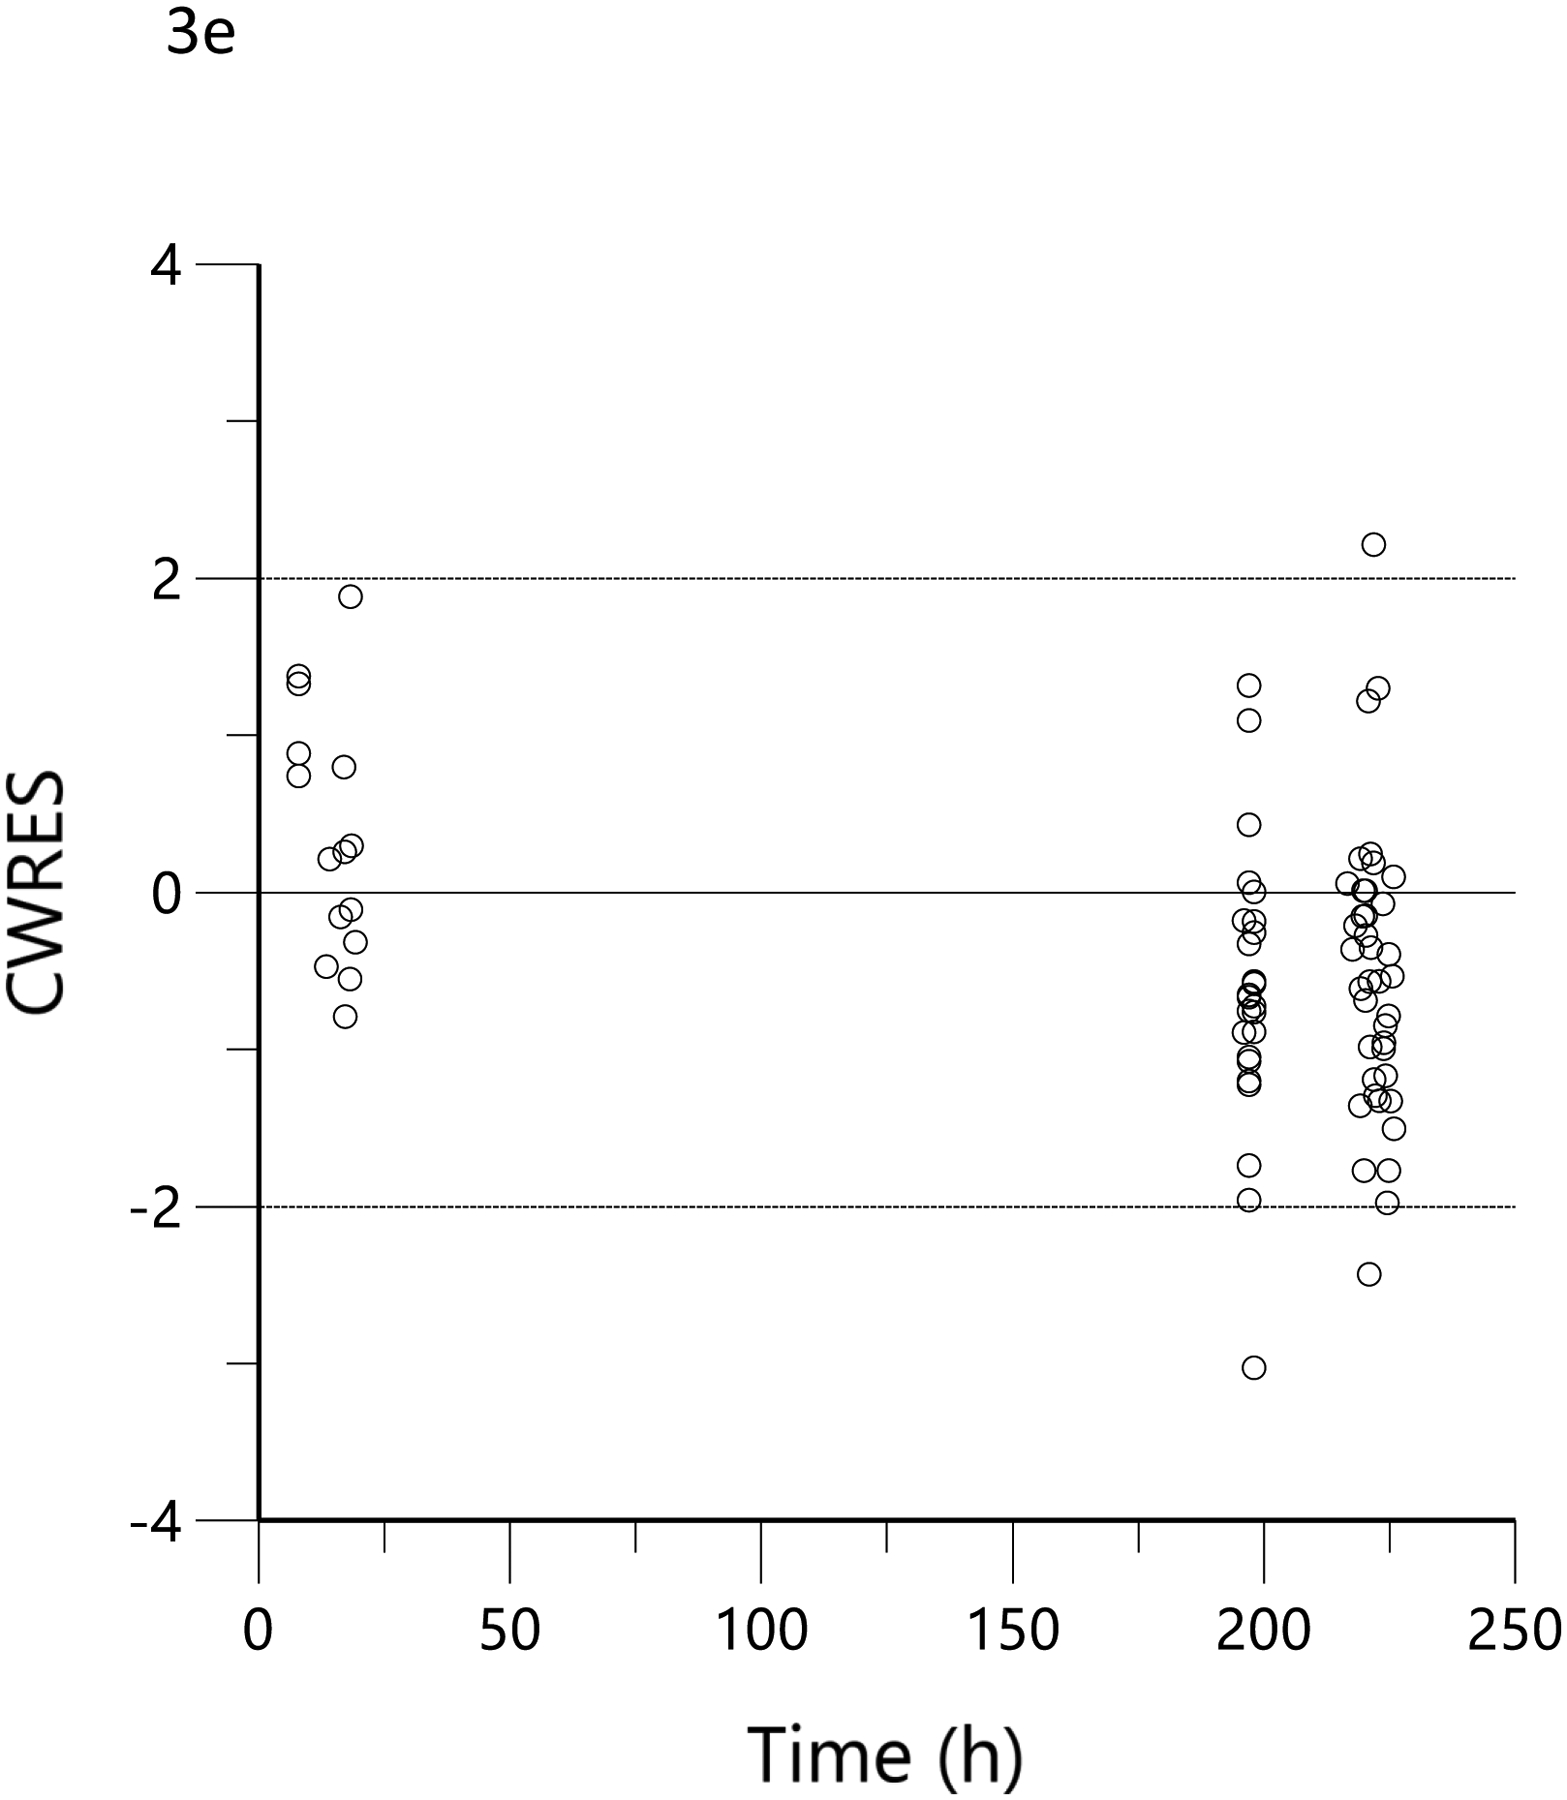
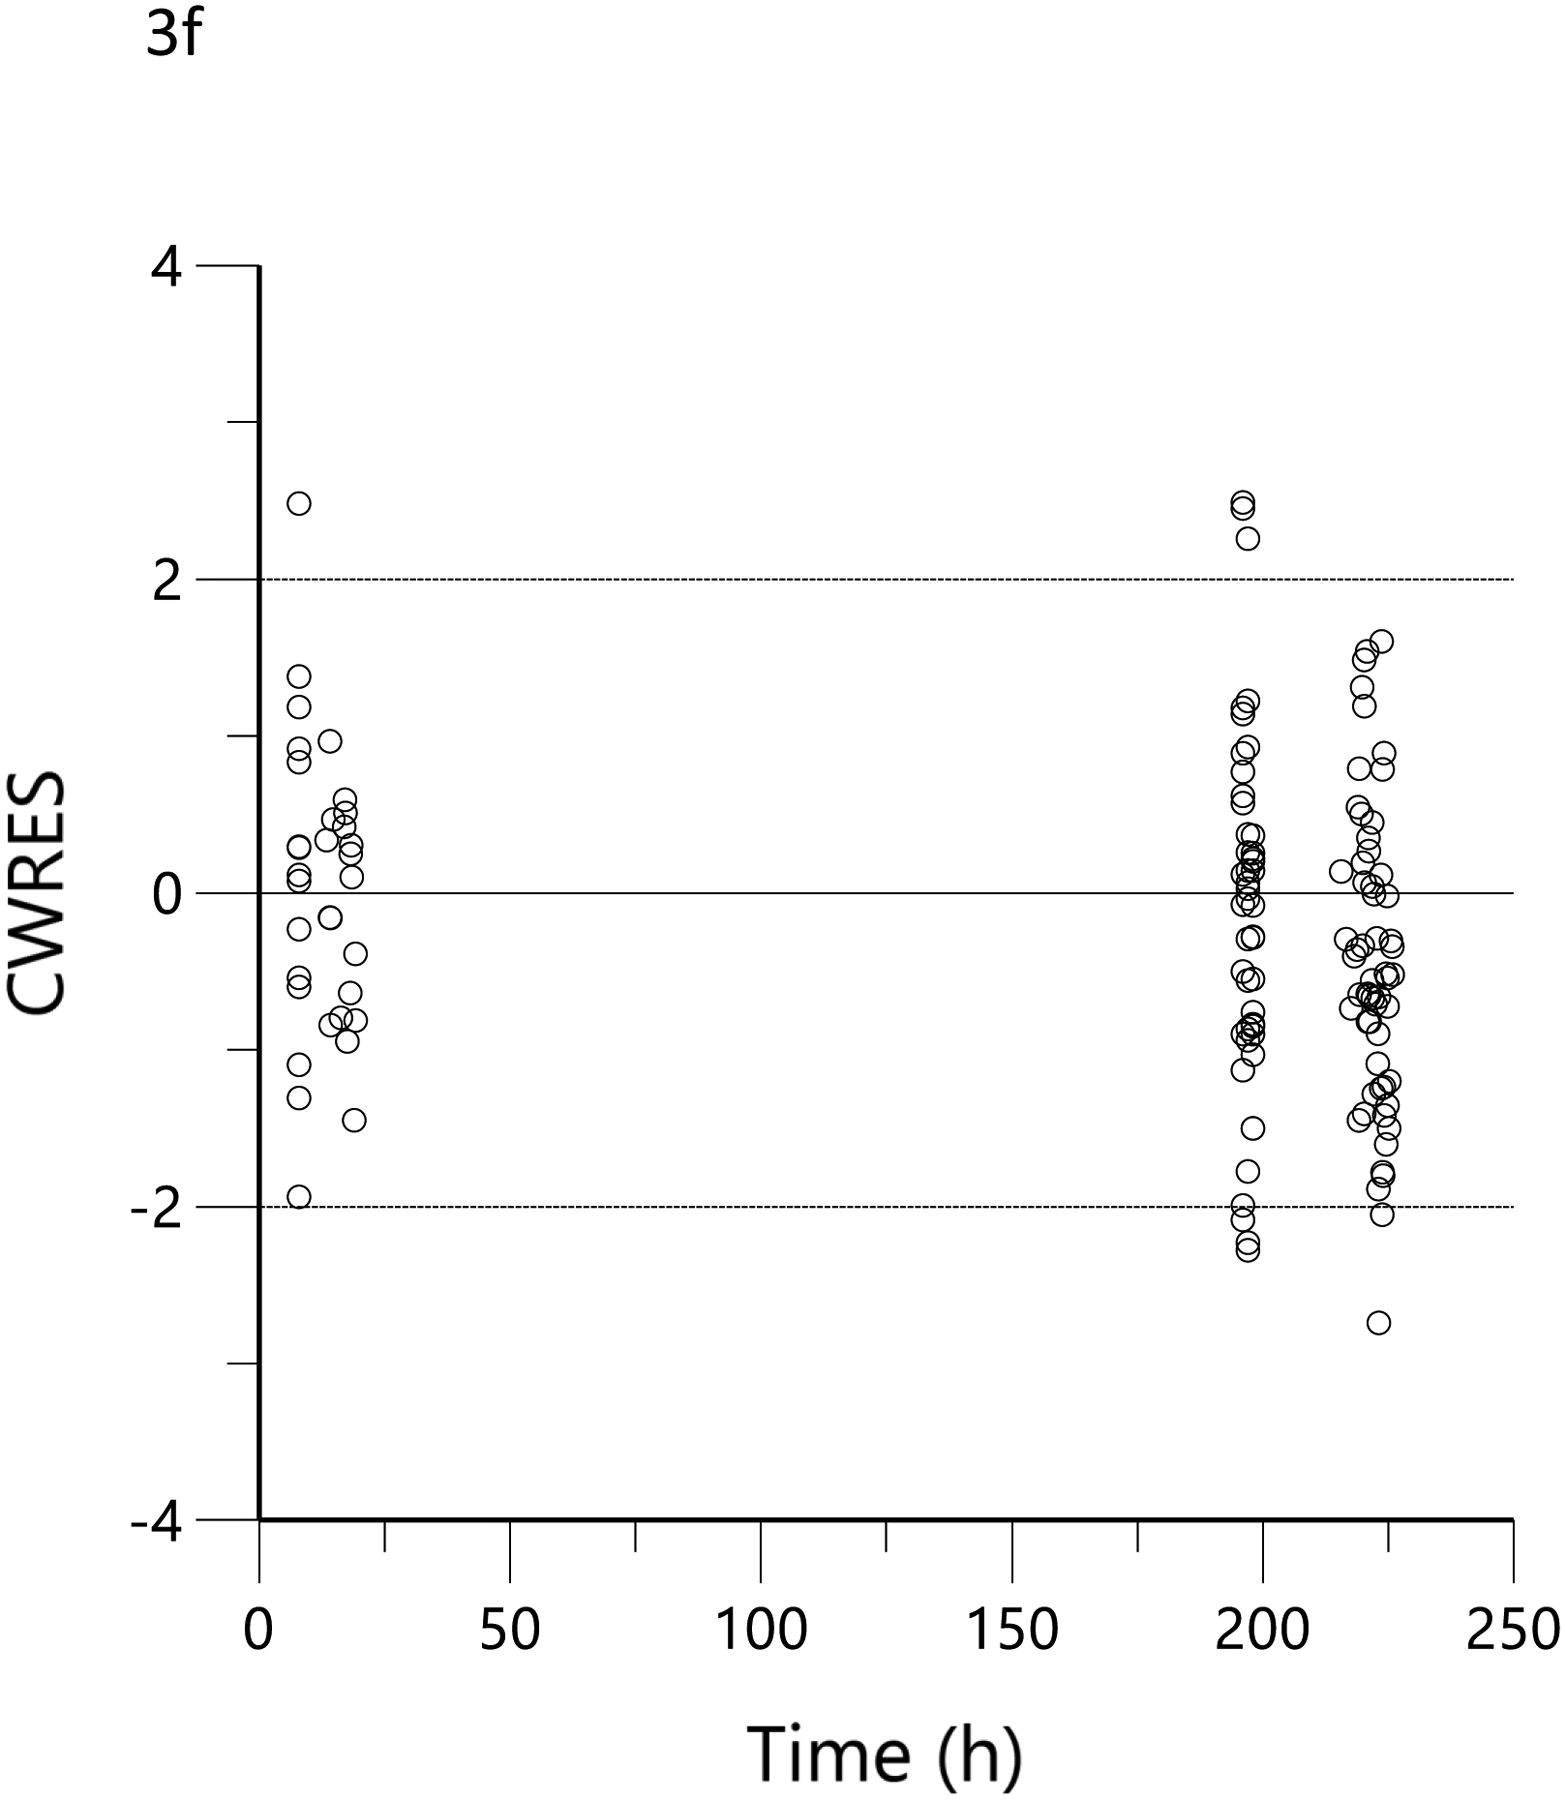
Conditional weighted residual (CWRES) versus predicted concentration for THC (a), 11-OH-THC (b) and THCCOOH (c) and versus time for THC (d), 11-OH-THC (e), and THCCOOH (f). Red lines are the locally weighted scatterplot smoothing (LOWESS) lines for the absolute residuals and its mirror. The blue line is the locally weighted scatterplot smoothing at the 50th percentile.
