
Figure 4.
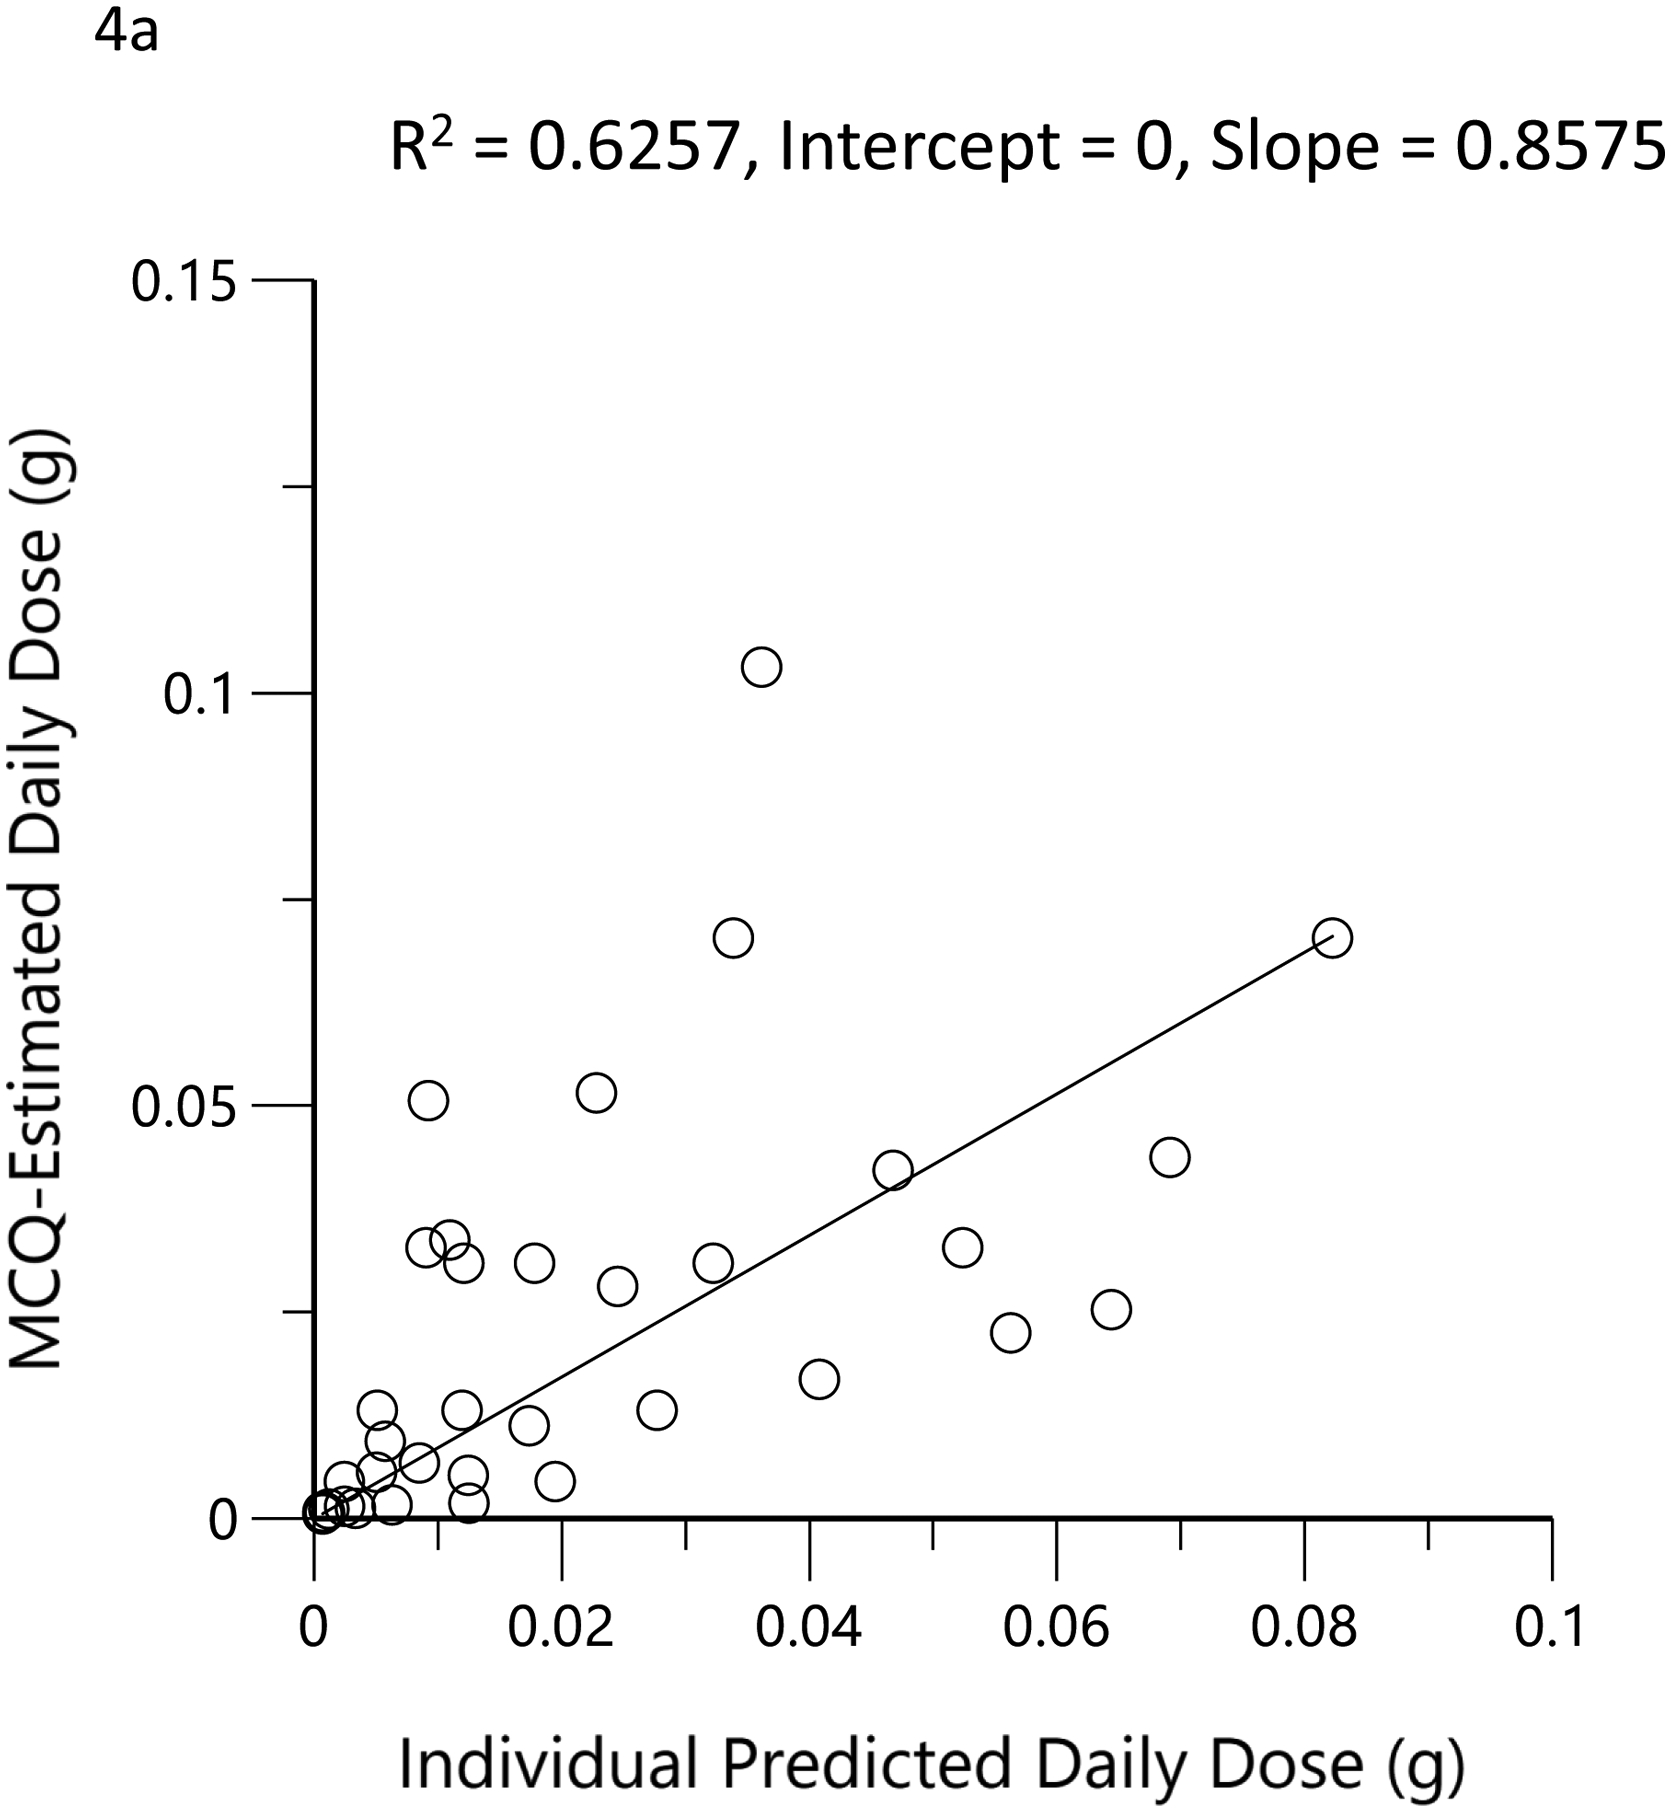
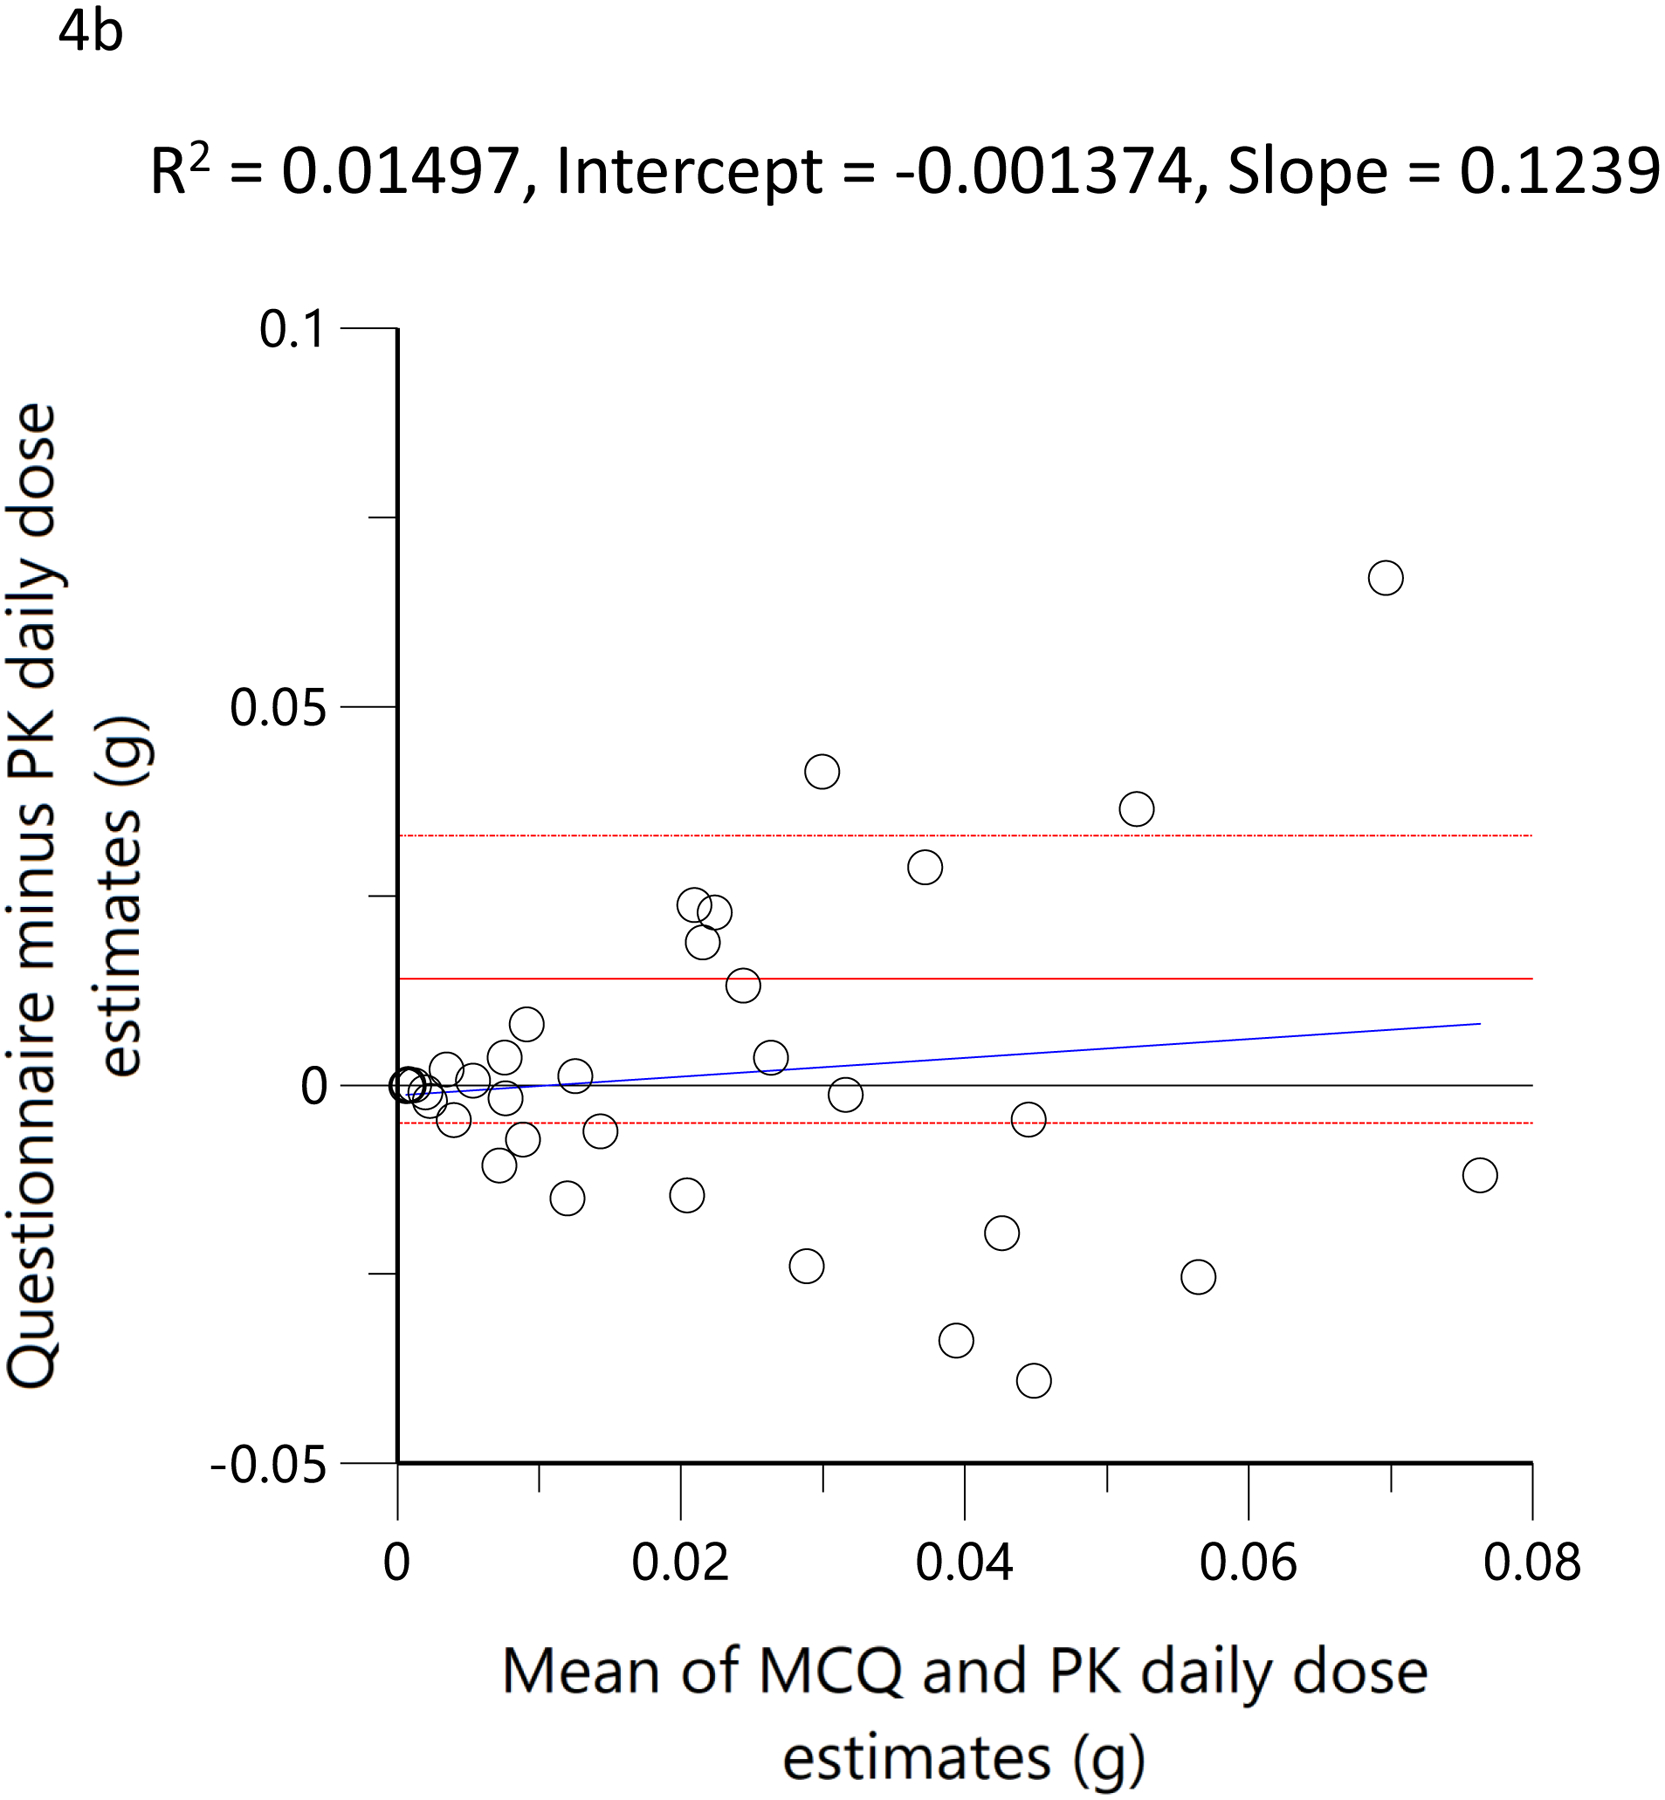
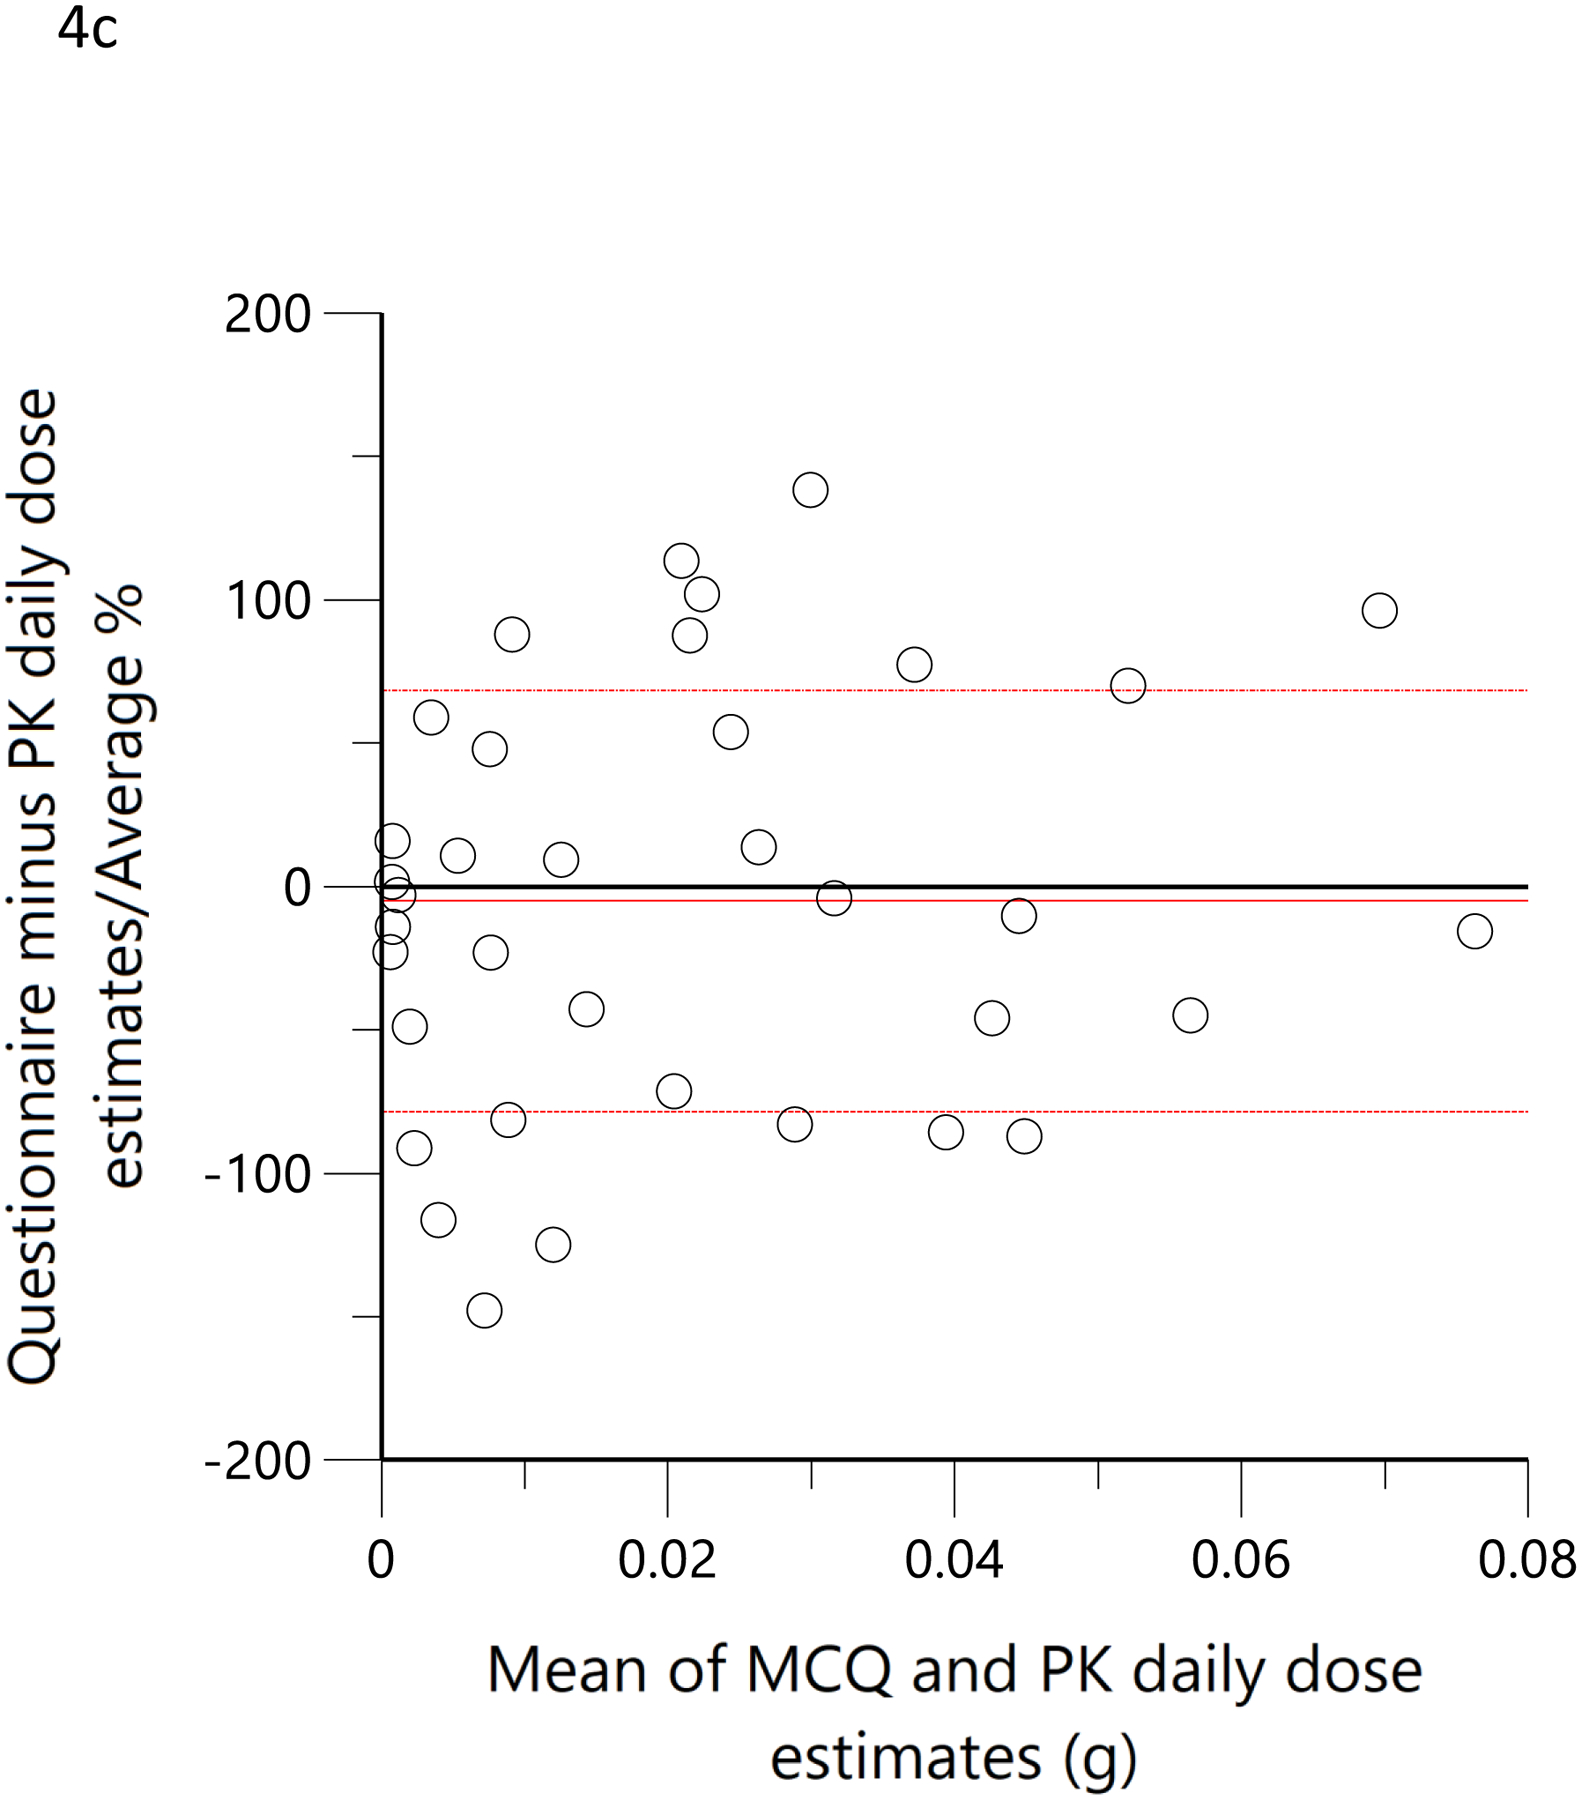
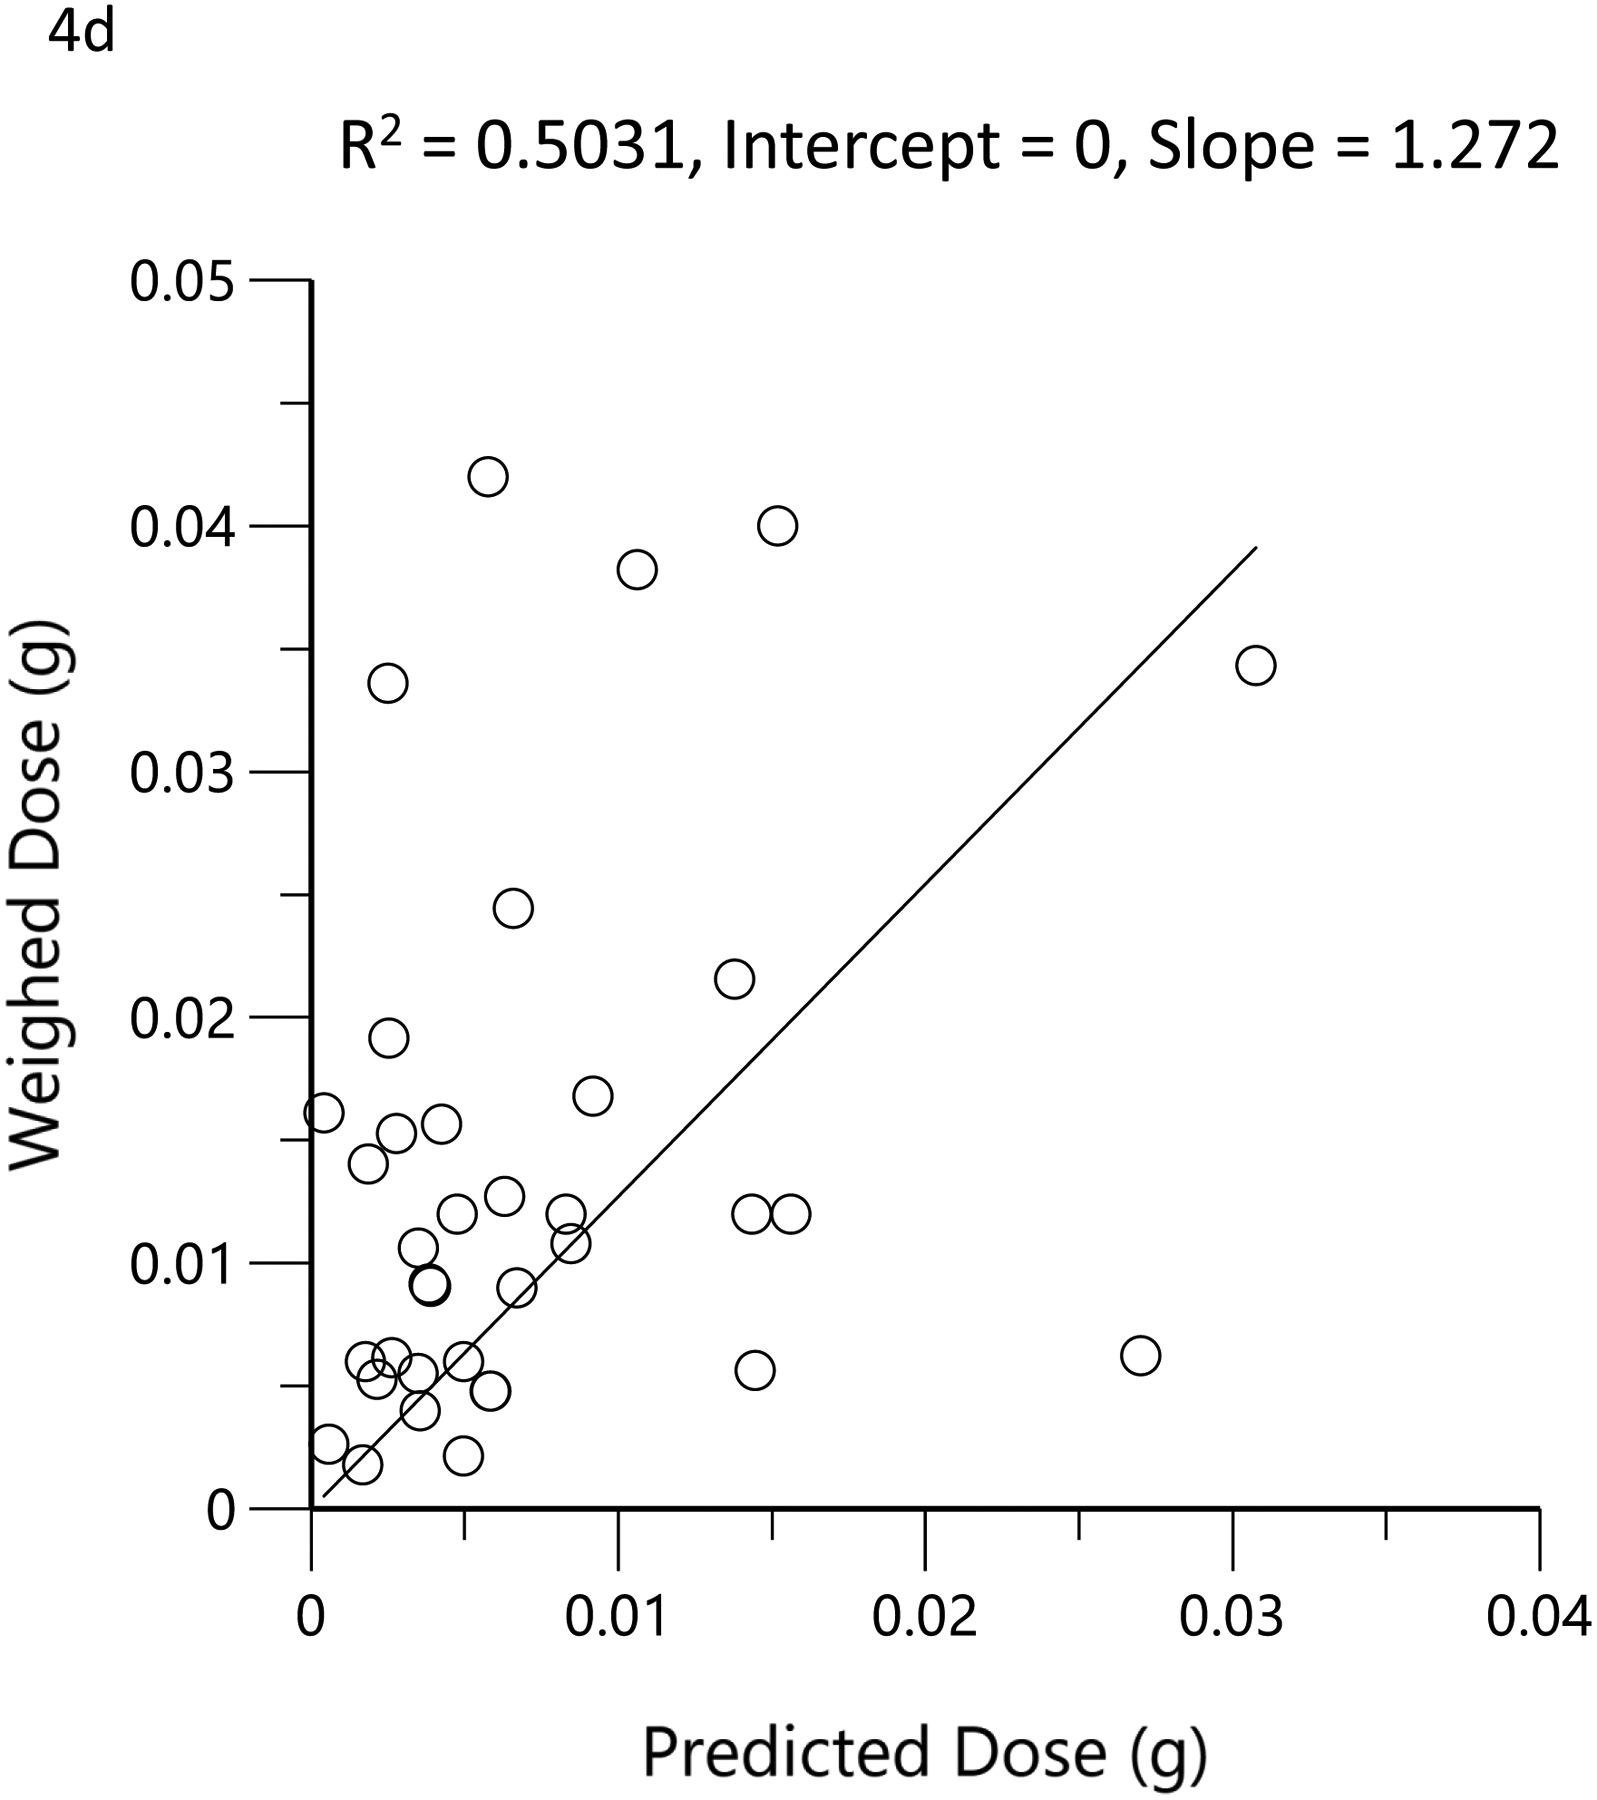
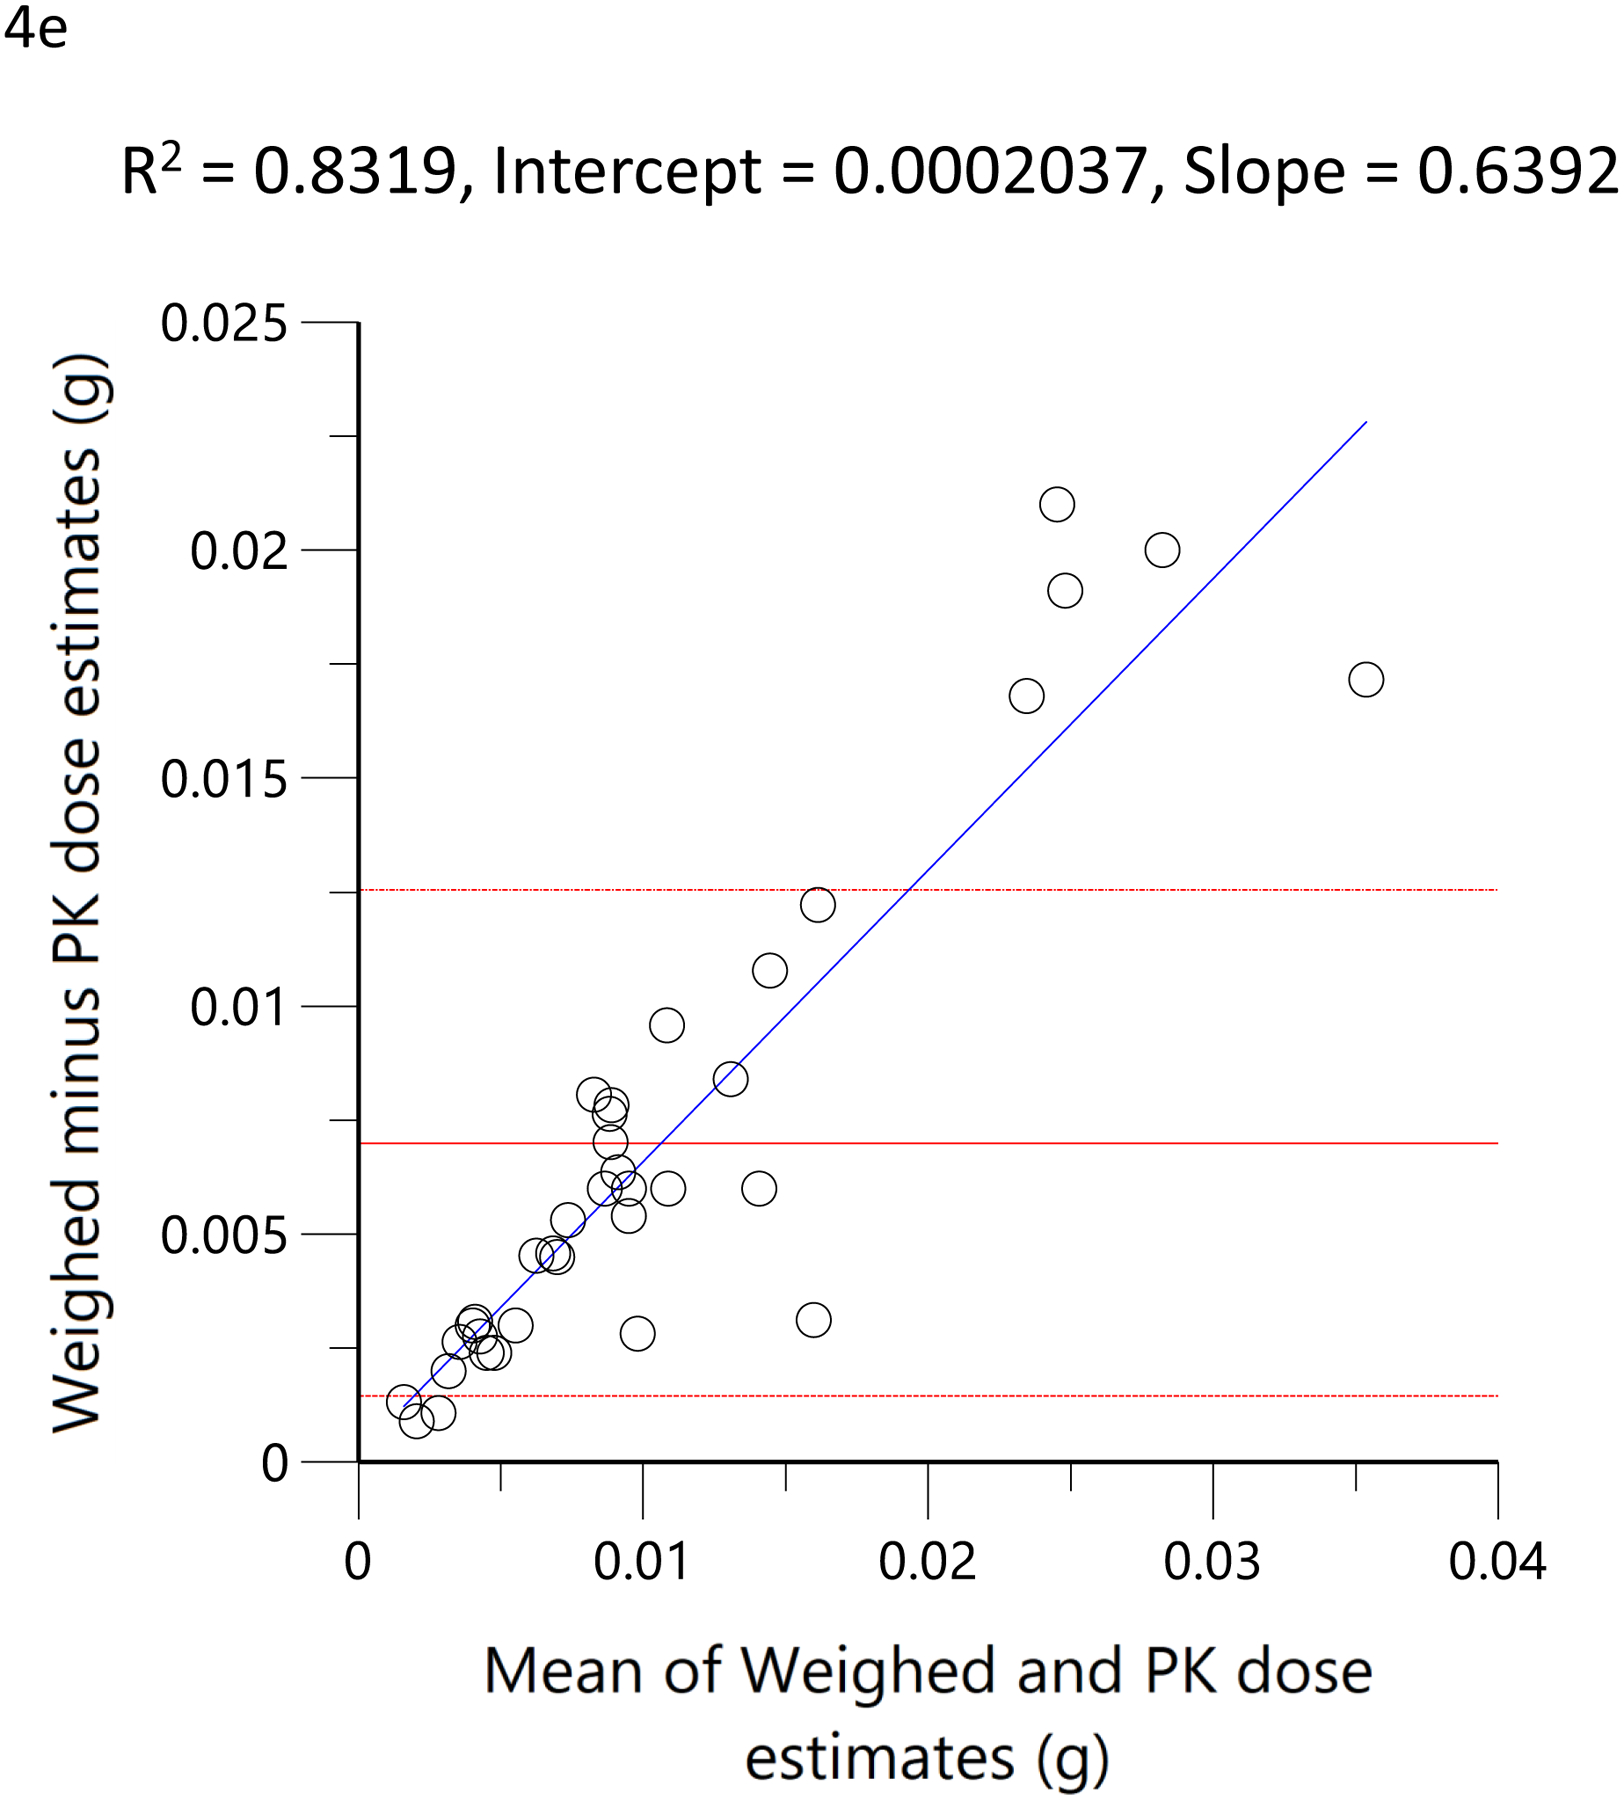
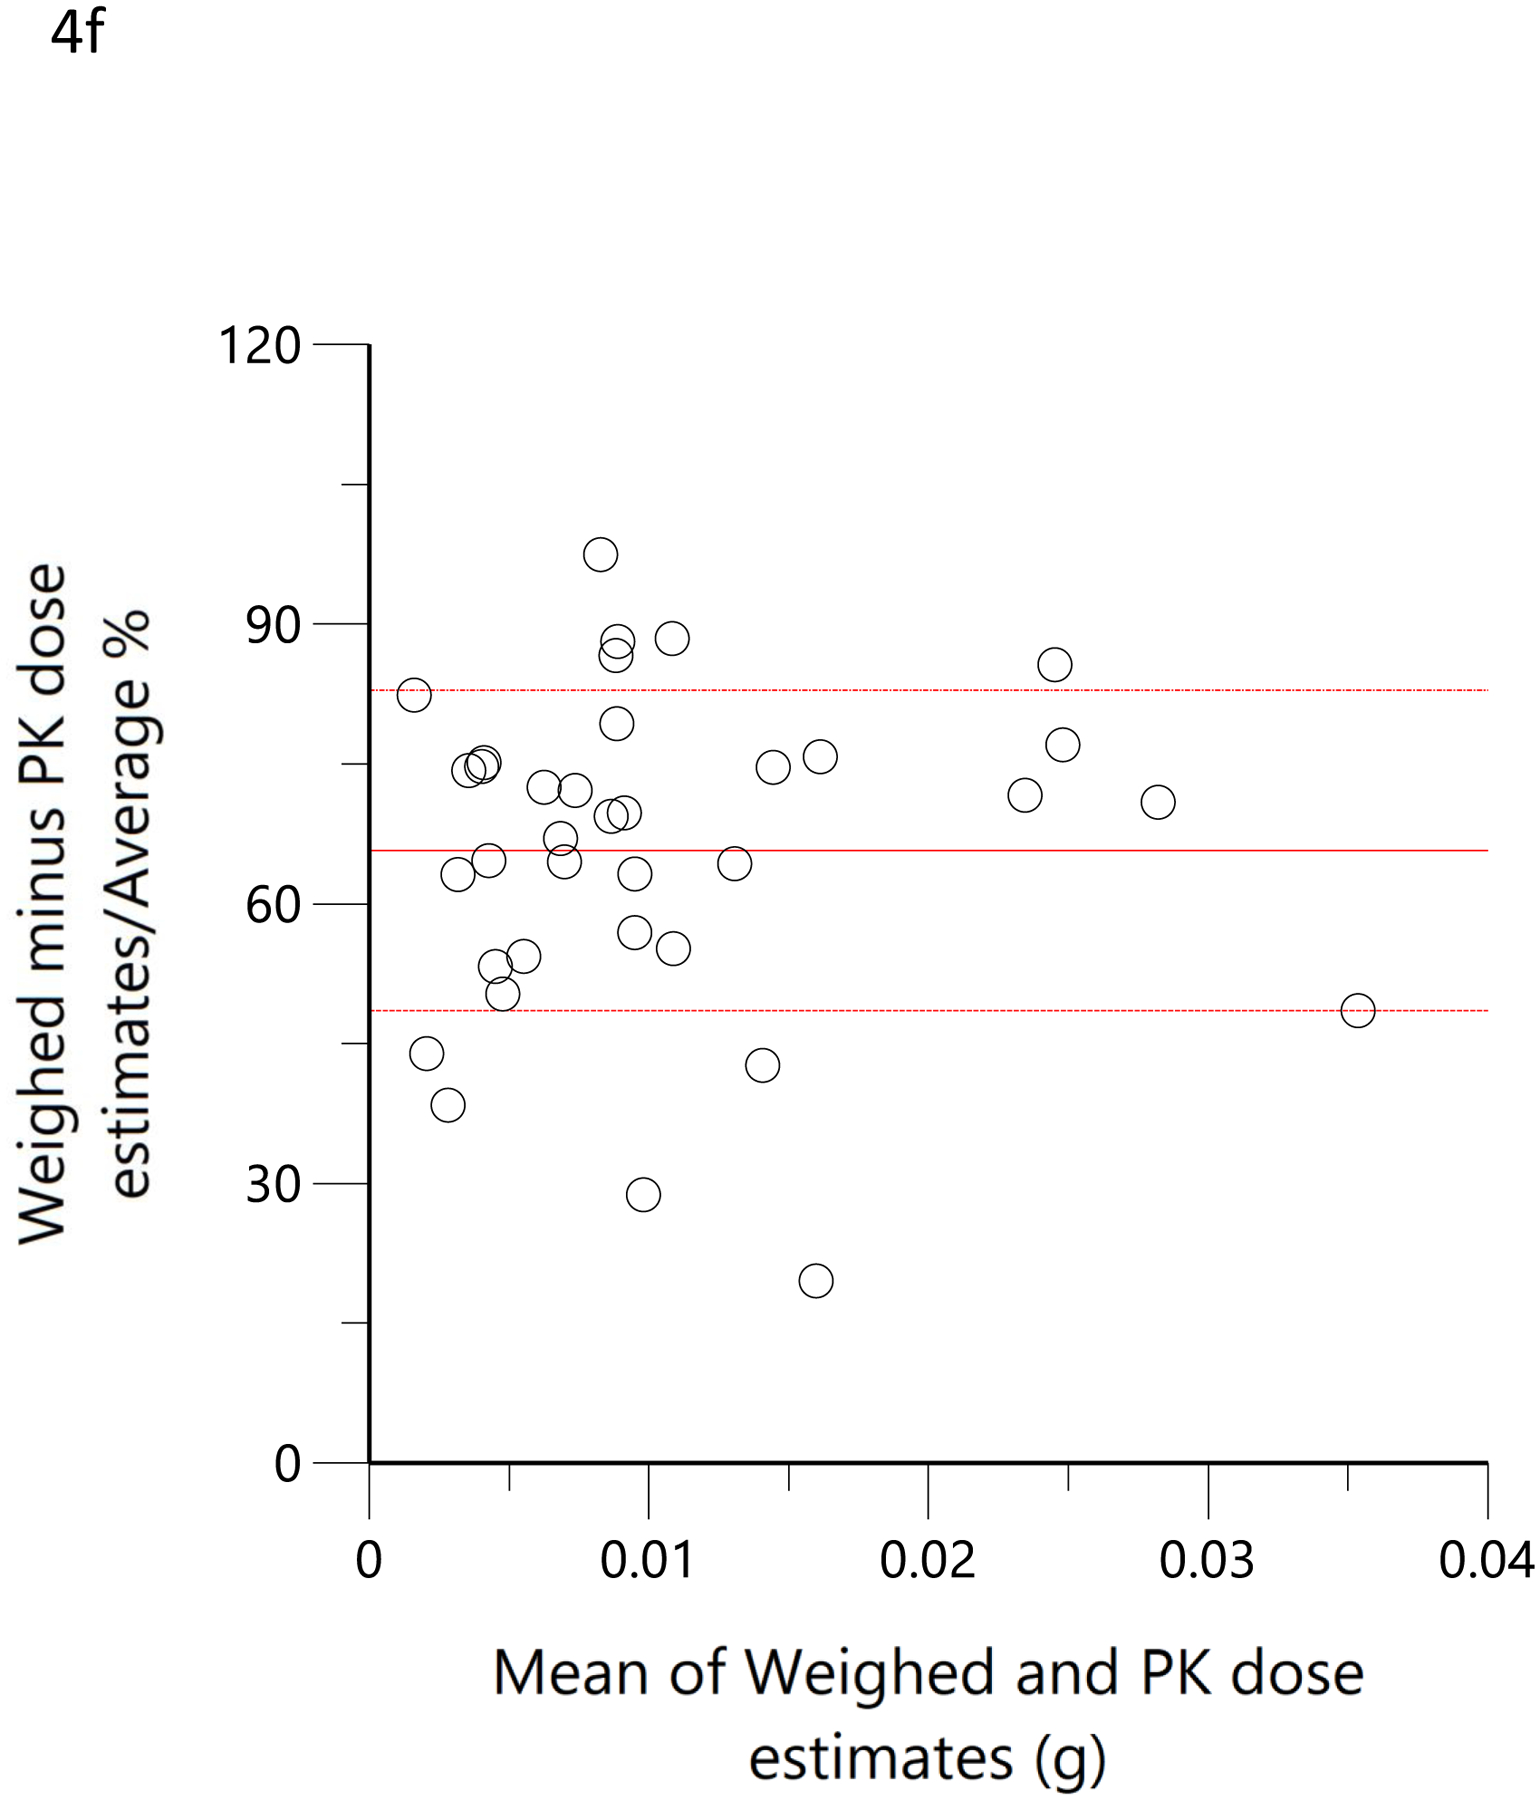
Scatterplots (open circles) of (a) each individual’s model-predicted daily THC dose (g/day) versus their cannabis consumption questionnaire (MCQ)-derived daily THC dose (g/day), (d) THC dose (g) during the ‘in home’ smoking event versus the THC dose (g), calculated as the difference between the weighed amount of cannabis to be consumed (corrected for the assigned THC content) and the weight of the remaining cannabis product brought back to the mobile lab. The black lines are the linear regressions. Bland-Altman plots of differences between MCQ- and PK-estimated doses versus the mean of the two estimates (b). The solid red line is the mean difference with the dotted red lines as standard deviation. The blue line is the regression of the differences versus the means. (c) Differences expressed as percentages of the estimated values versus the mean of the two estimates. The solid red line is the mean difference (bias) with the dotted red lines as standard deviation. Bland-Altman plots of differences between weighed amount- and PK-estimated doses versus the mean of the two estimates (e). The solid red line is the mean difference with the dotted red lines as standard deviation. The blue line is the regression of the differences versus the means. (f) Differences expressed as percentages of the estimated values versus the mean of the two estimates (f). The solid red line is the mean difference (bias) with the dotted red lines as standard deviation.