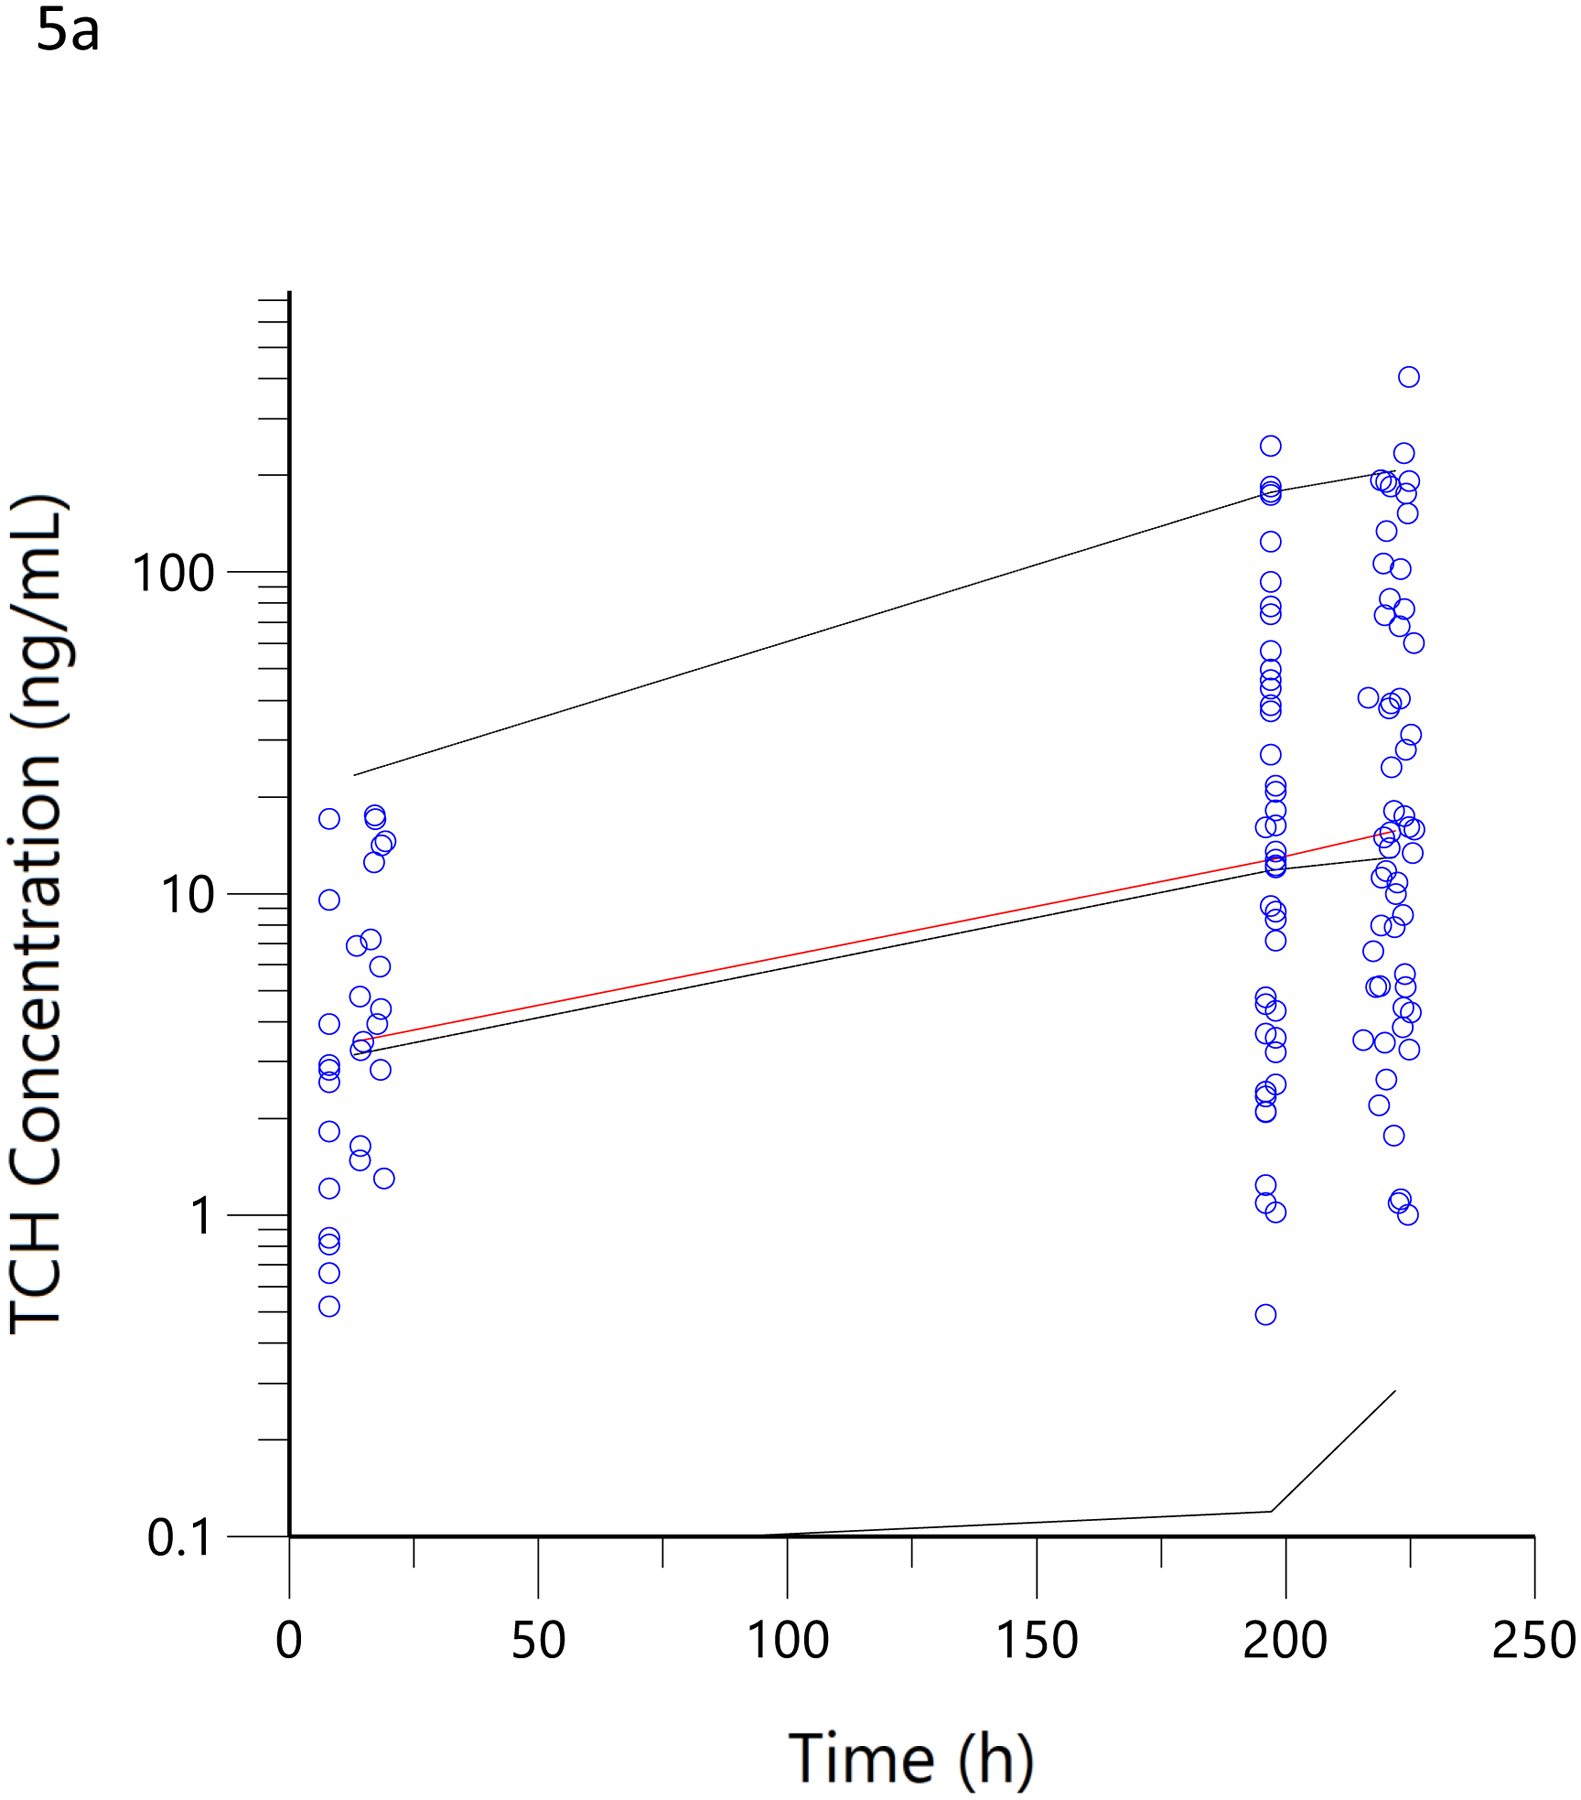
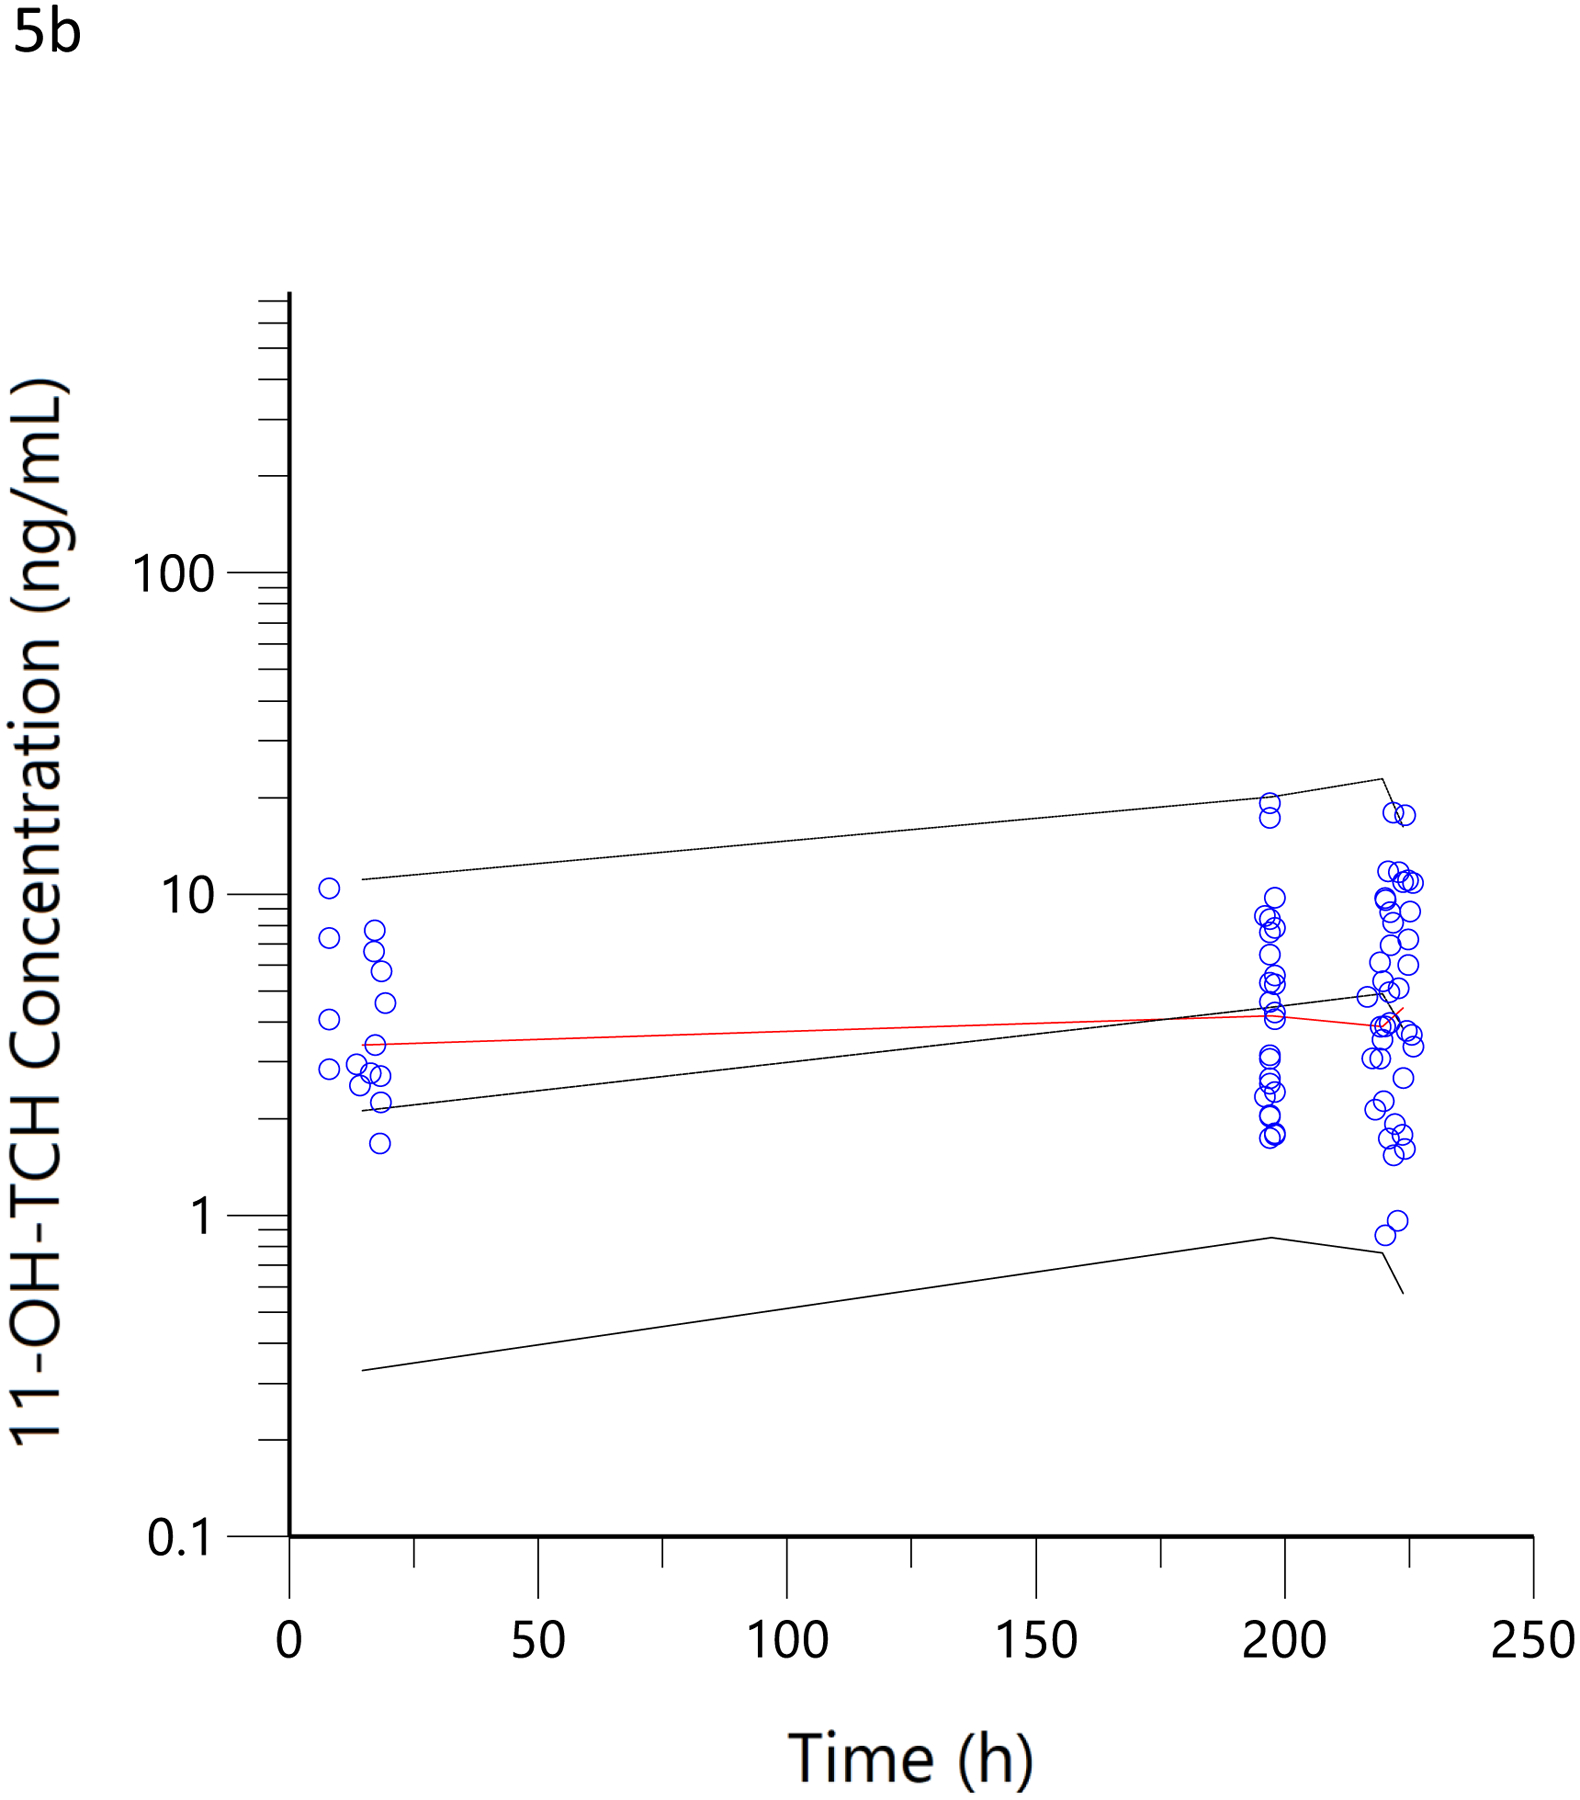
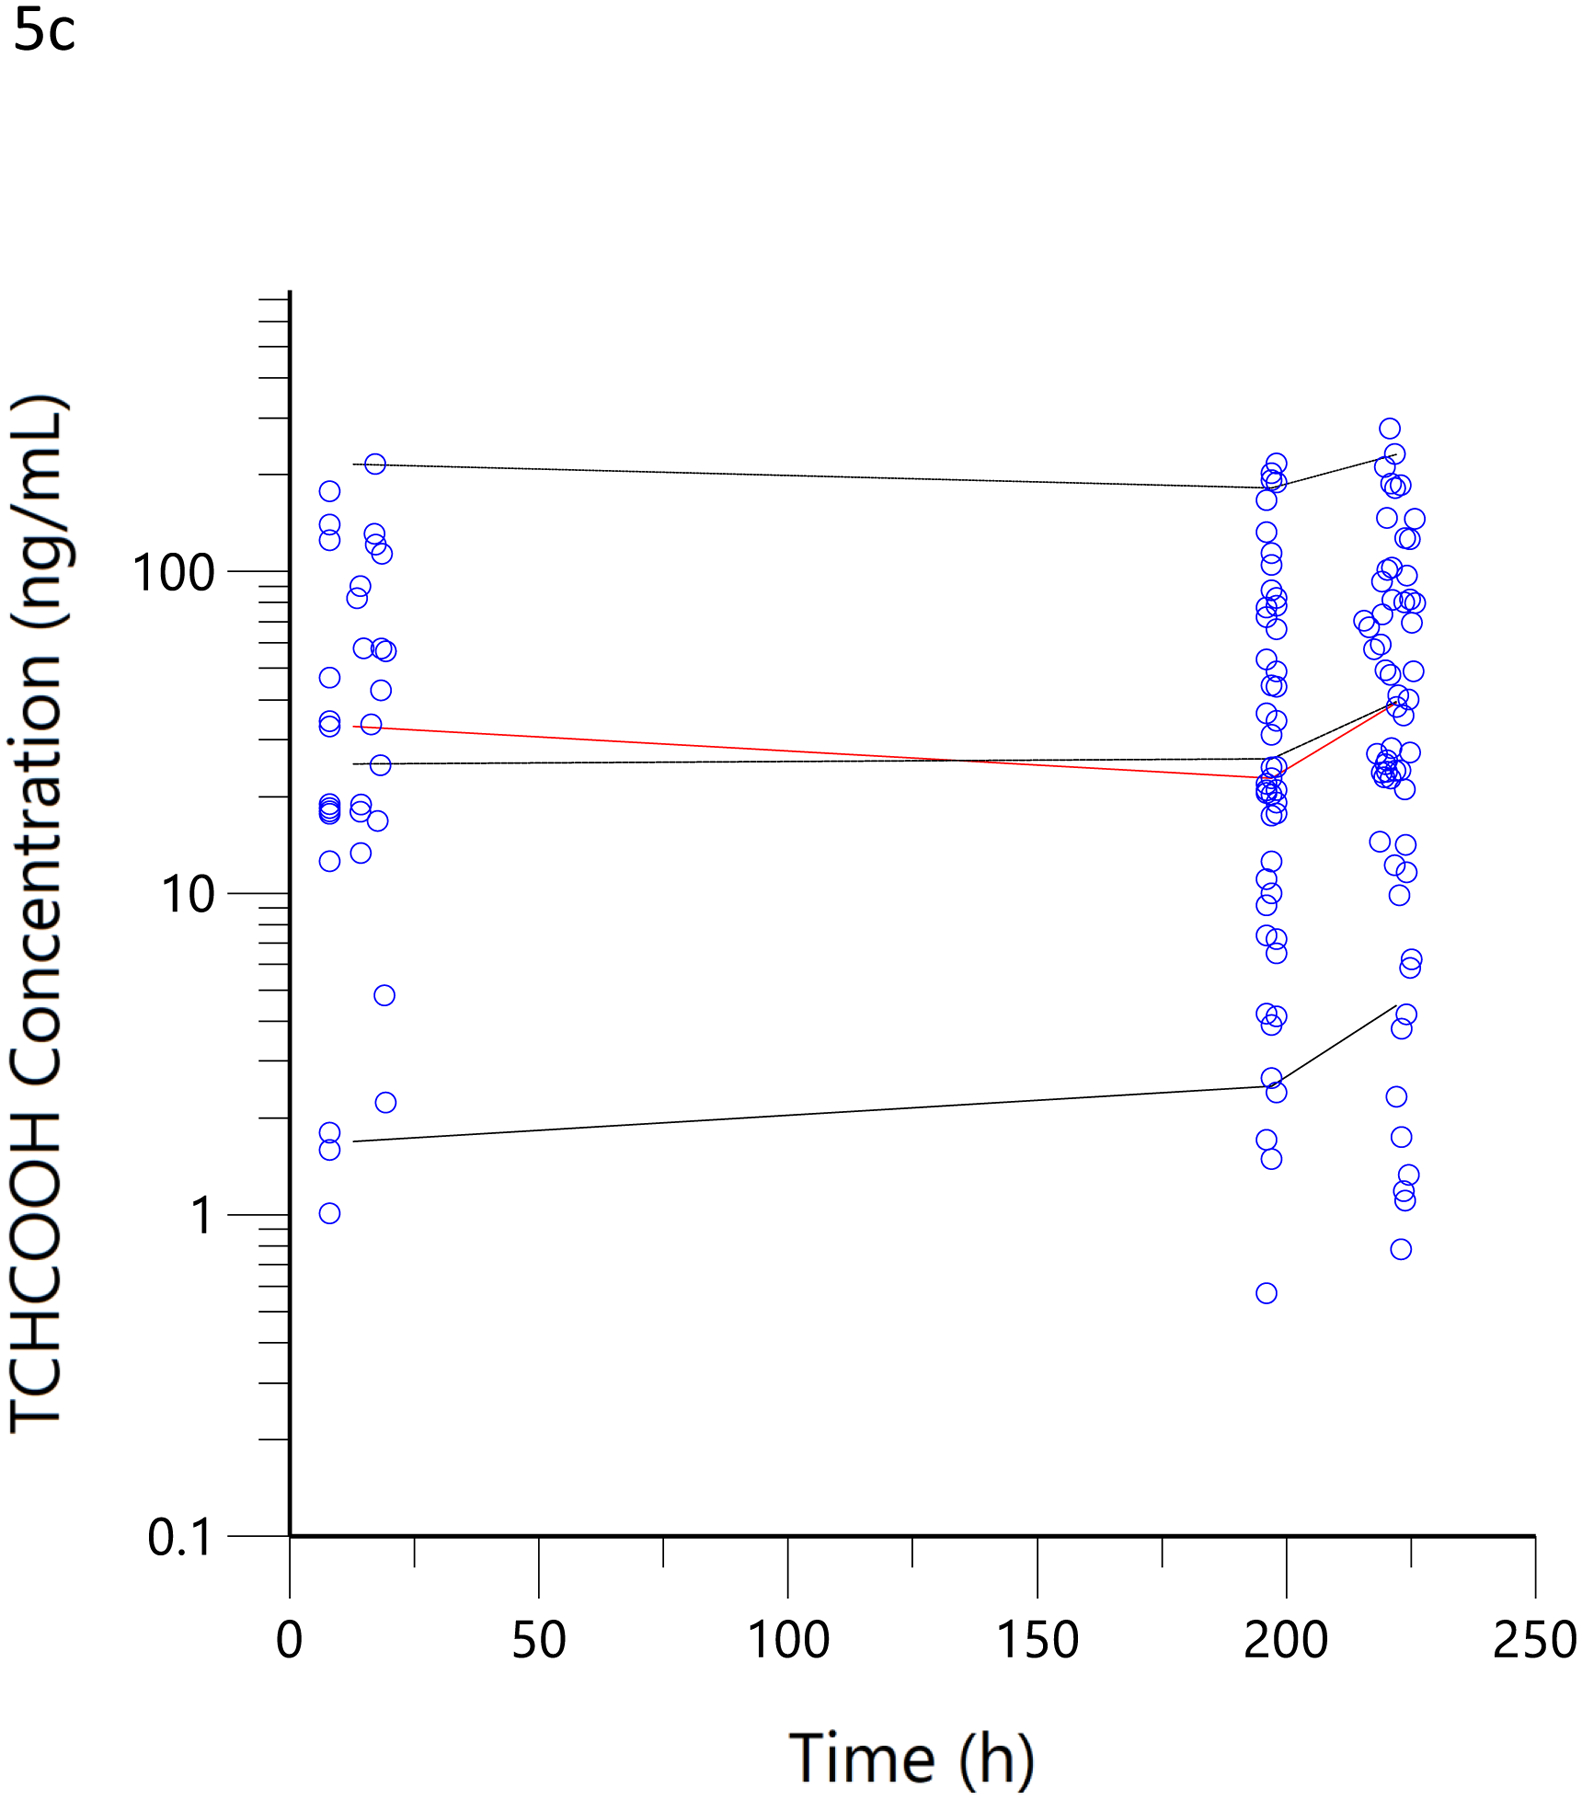
Figure 5.


Visual predictive checks. The blue circles represent the observed data for THCCOOH (a), 11-OH-THC (b) and THC (c) concentrations for the low and high doses. The black lines represent the 95th, 50th, and 5th percentiles of the simulated concentrations at each time point.
