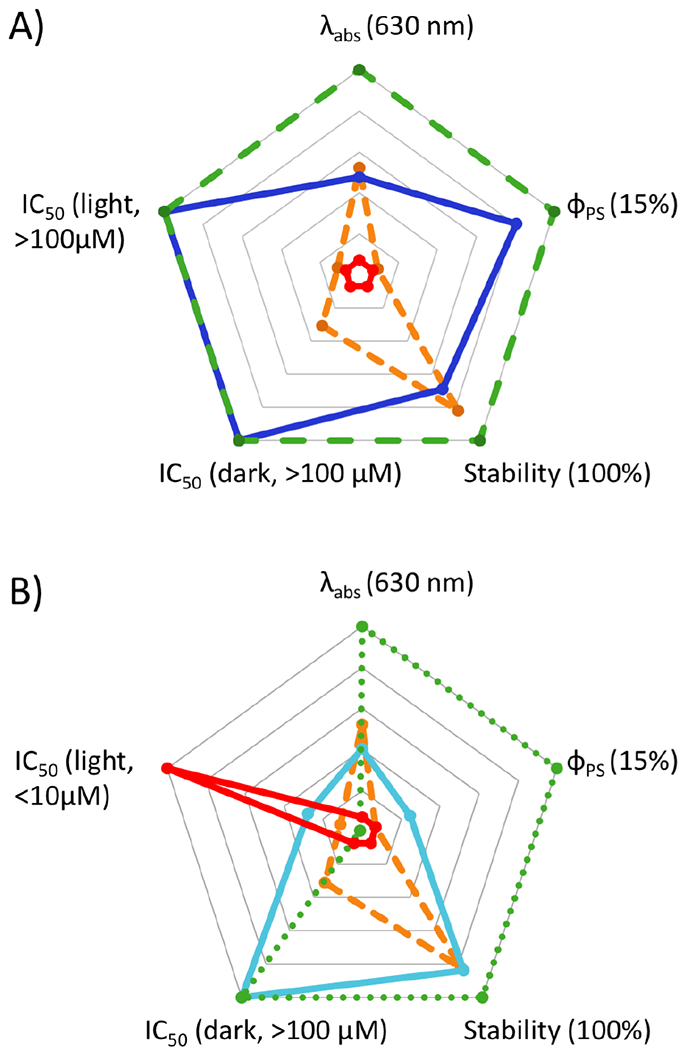
Figure 4.

Radar charts for comparison of the key features for photocages (A) and dual action agents (B). A) The “ideal pure photocage” (dashed green) compared with a hypothetical negative control (solid red), compound 9 (dashed orange), and 11 (solid blue). The axes scale from center to perimeter as follows: Absorbance, 420–630 nm; ΦPS, 0–15 %; stability (%) and IC50 for cytotoxicity (μM), 0–100. The desired parameters for an “ideal pure photocage” are indicated in parentheses. B) The “ideal dual action agent” (dotted green) compared with the hypothetical negative control (solid red), compound 9 (dashed orange), and 12 (solid aqua). Note: the axes scales and desired parameters are the same as for A) except for the IC50 (light), which scales from 1–100 μM from the center to perimeter. For a dual action agent, a low value is preferred.
