
Figure 2. Sox6 expression defines a dorsal-ventral division of the murine SNc.
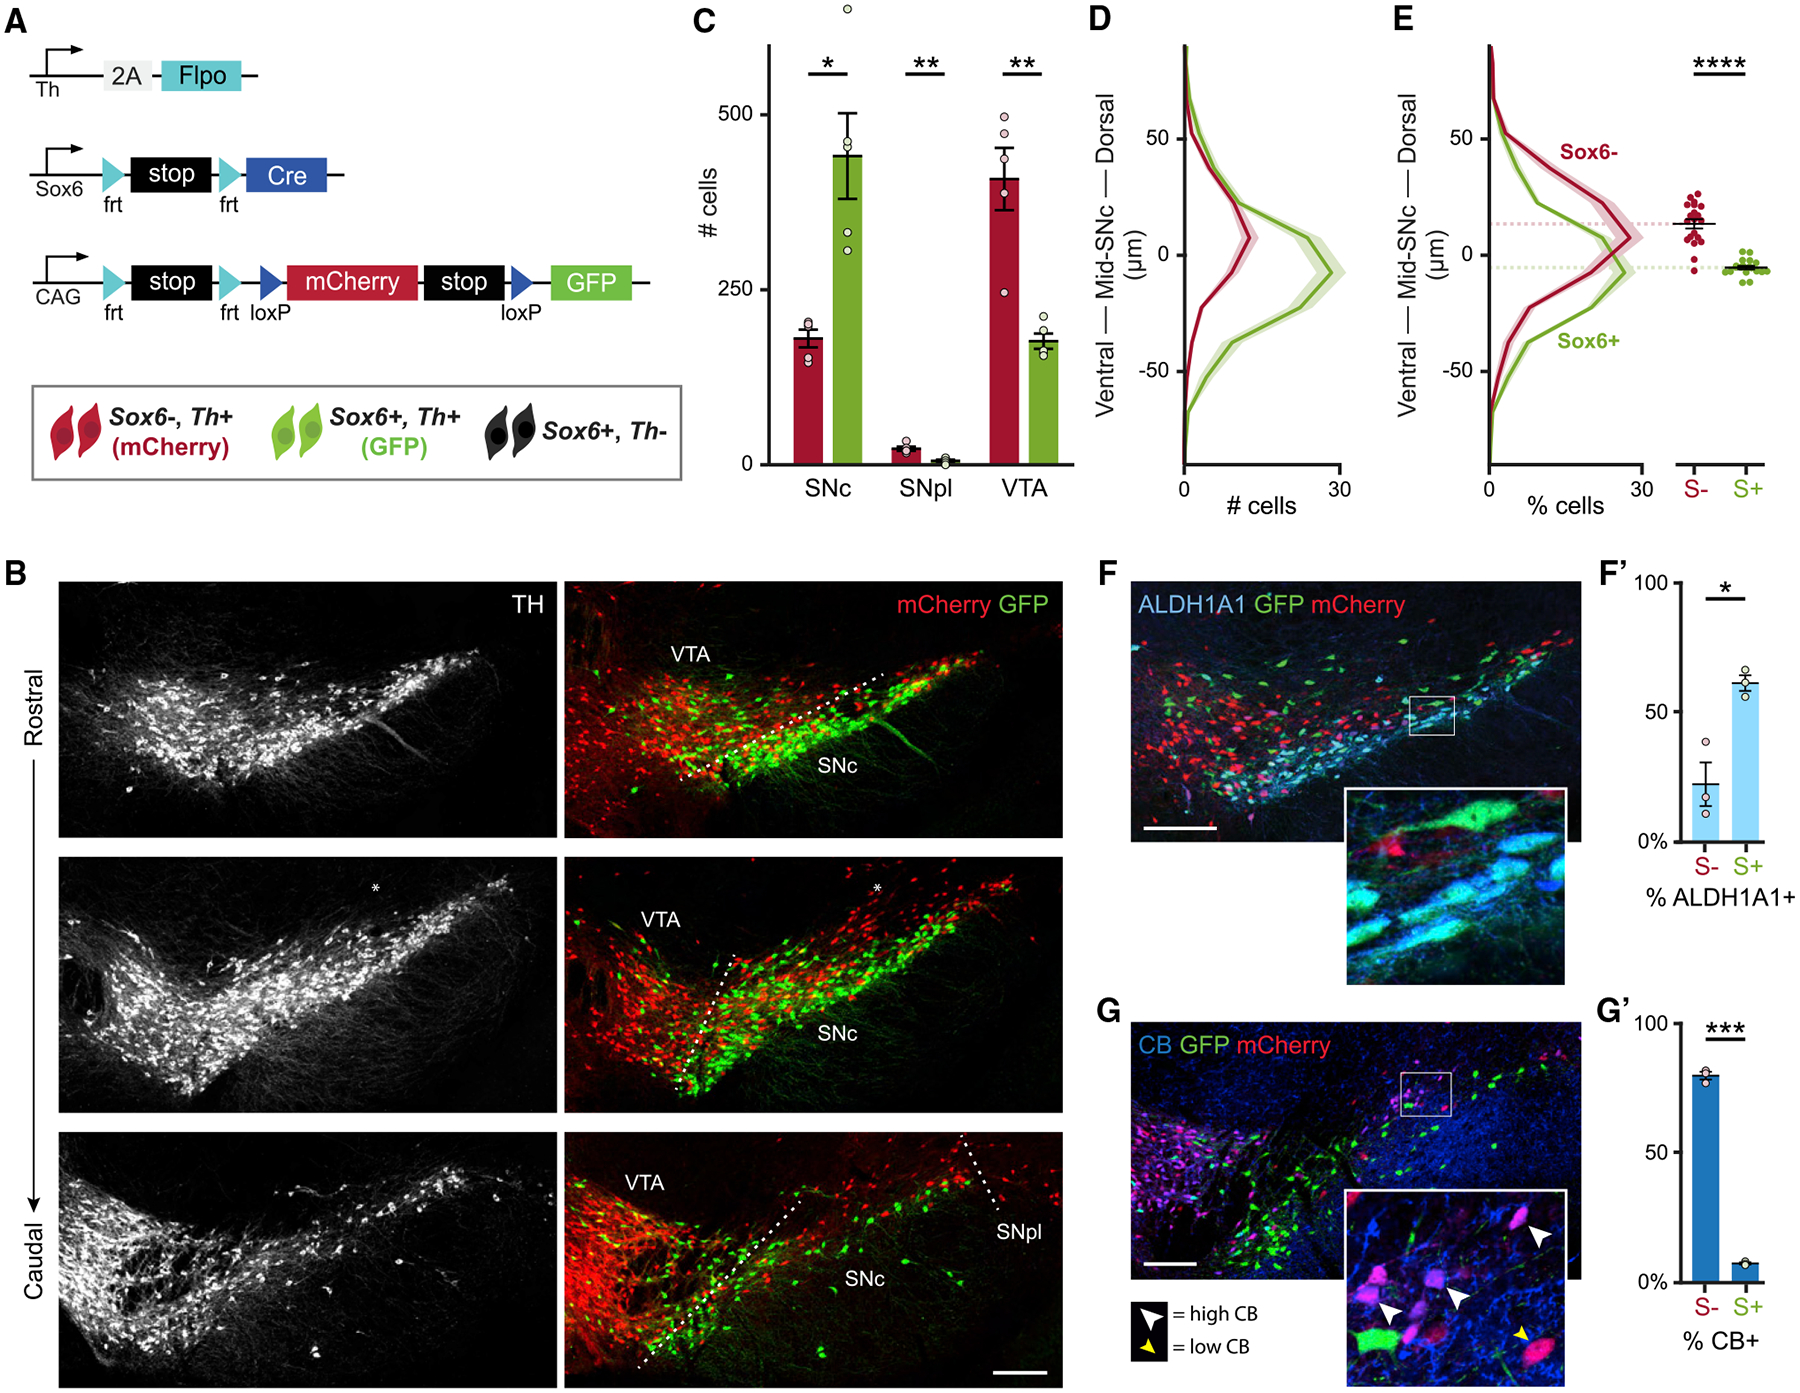
(A) Simultaneous intersectional/subtractional genetic labeling strategy.
(B) Example of an adult Sox6-FSF-Cre, Th-2A-flpo, RC-Frepe brain. Some mCherry+ cells are observed above the SNc, lacking TH immunoreactivity (*).
(C) Average number of TH+,mCherry+ (red bars) and TH+,GFP+ (green bars) in the main DA neuron areas. p values: SNc = 0.014, SNpl = 0.004, VTA = 0.008.
(D) Histogram of spatial coordinates of TH+,GFP+ or TH+,mCherry+ cells; TH+,mCherry+ neurons are biased dorsally.
(E) Left: histogram of spatial coordinates of TH+,GFP+ or TH+,mCherry+ cells normalized to total TH+,GFP+ or TH+,mCherry+ cells. Right: centroid of GFP+ and mCherry+ populations for each section of each mouse included in left panel (4 sections per brain) (p = 6 × 10⁻⁷).
(F) GFP+ cells co-express ALDH1A1 (SNc).
(F’) Percentage of GFP+ (Sox6+) and mCherry+ (Sox6−) neurons co-expressing ALDH1A1 in the SNc. p = 0.02.
(G) Most mCherry+ cells express CALBINDIN-D28k (CB) (SNc). CB signal intensity varies from low (yellow arrowhead) to high (white arrowhead).
(G’) Percentage of GFP+ (Sox6+) and mCherry+ (Sox6−) neurons co-expressing CB in the SNc. p = 0.0007.
Scale bars: 200 μm. Error bars (C’, F’, and G’) and shaded areas (D and E) are SEMs. S+: Sox6+, S−: Sox6−. (A)–(E) n = 5, (F) and (G) n = 3.