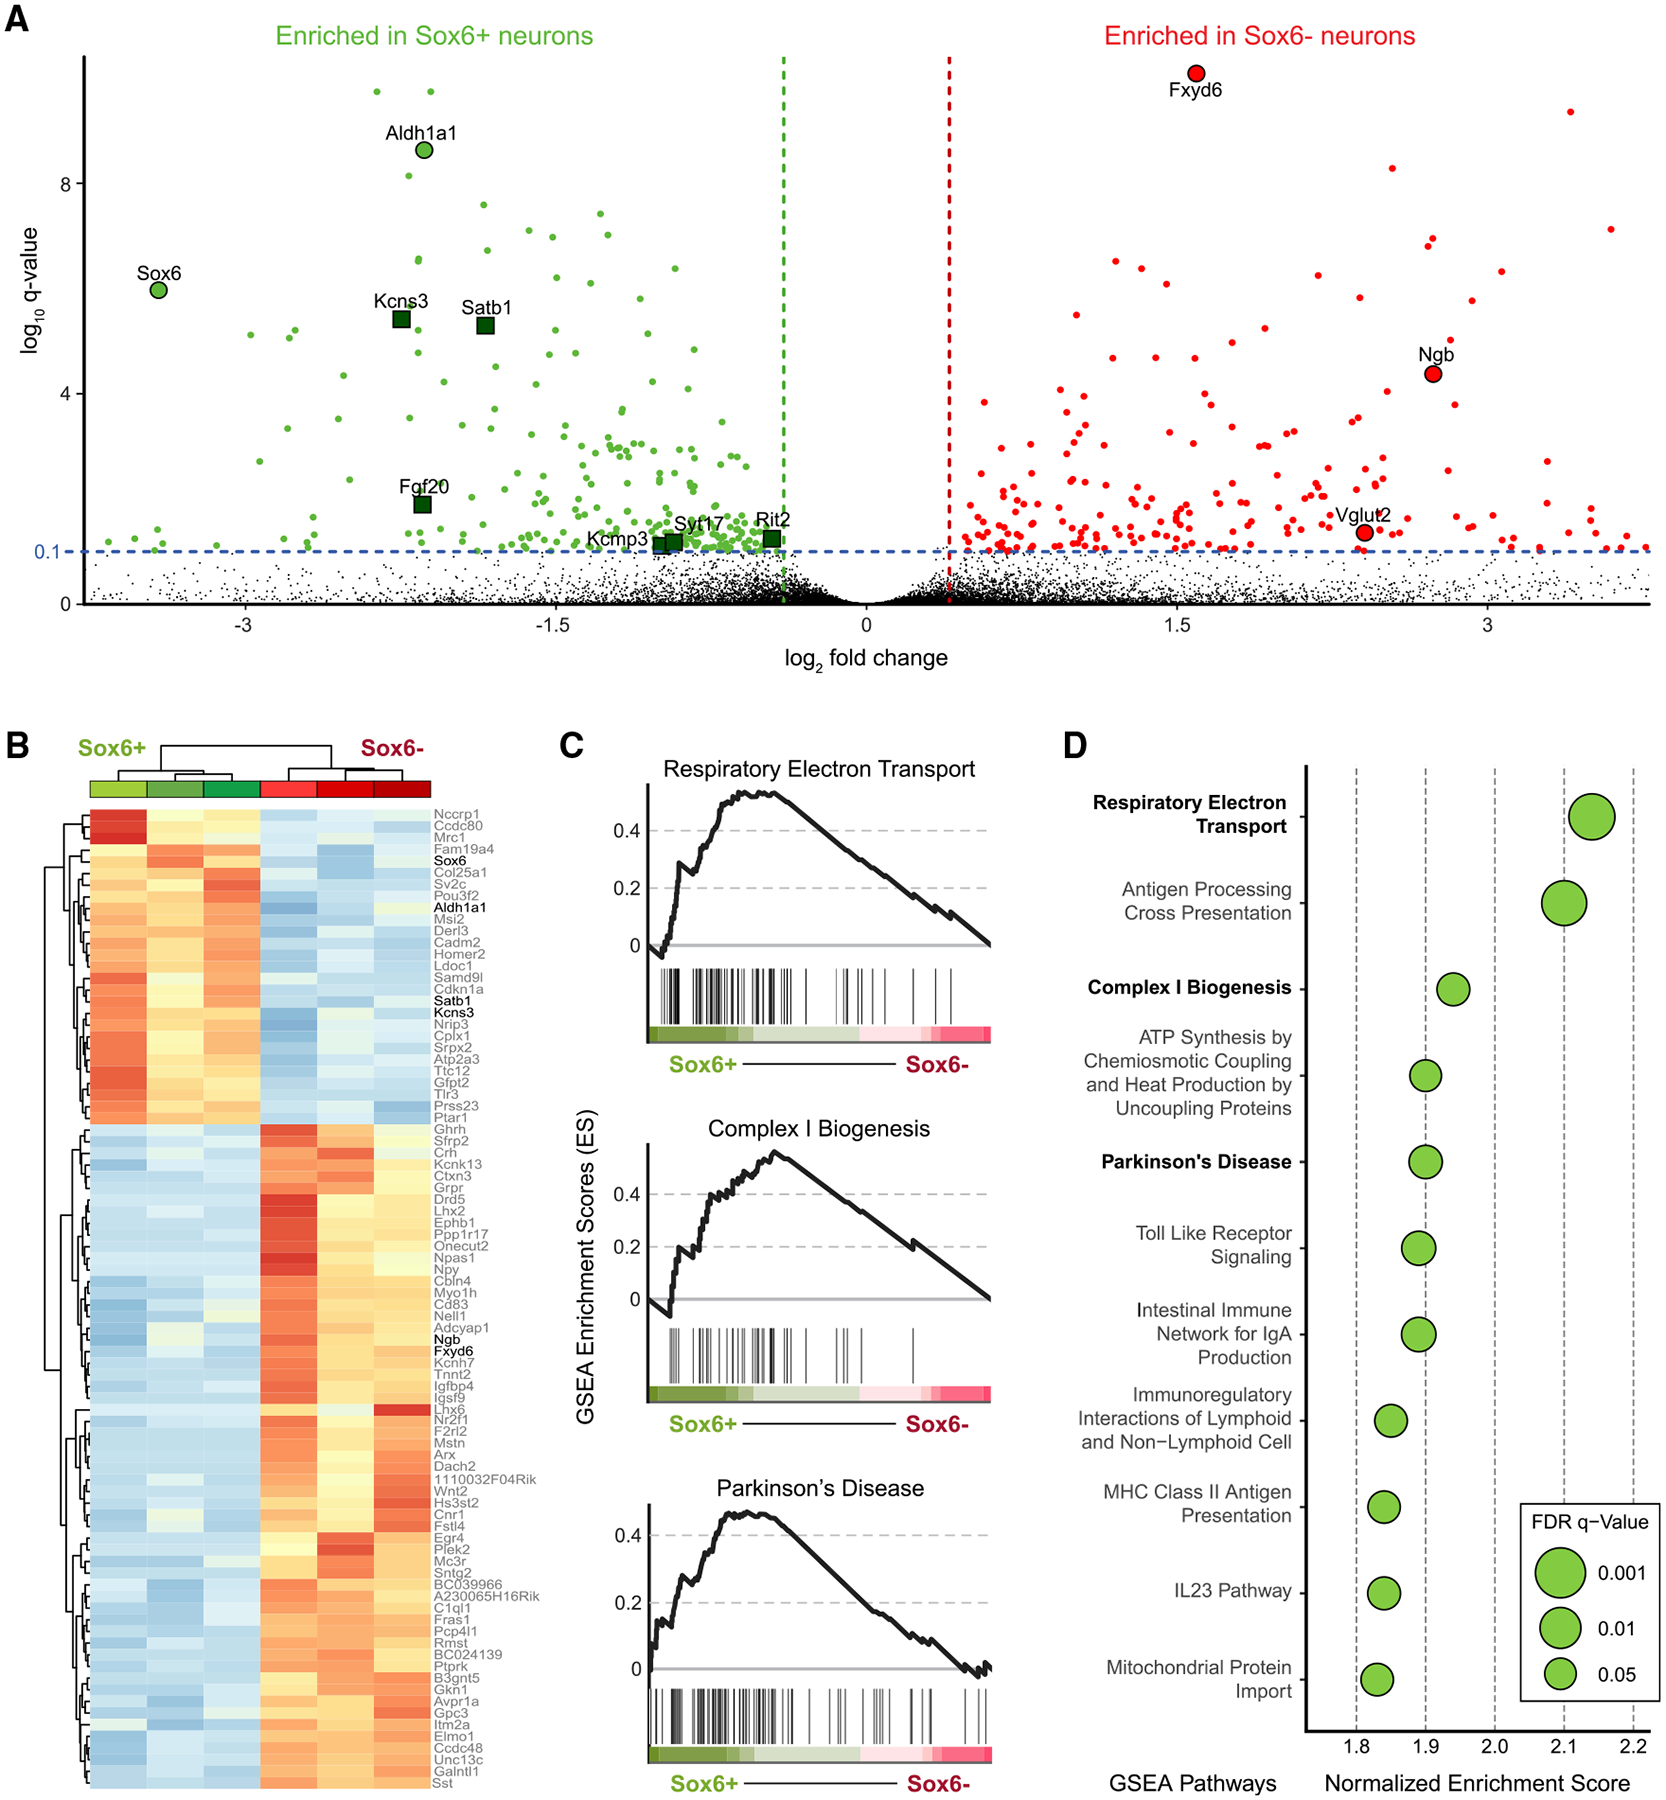
Figure 3. Transcriptomic analysis of Sox6+ and Sox6− SNc cohorts.

(A) Volcano plot showing gene expression differences between GFP+ (Sox6+) and mCherry+ (Sox6−) cells. Green squares are PD risk loci.
(B) Unbiased clustering of Sox6+ and Sox6− samples, n = 3 each.
(C) Gene set enrichment analysis (GSEA) plots of gene sets enriched in the Sox6+ population associated with mitochondrial function and ATP synthesis (top, center) and PD (bottom). The peak of the curve indicates the enrichment score (ES), black lines below the curve, to the left of the peak, indicate the genes contributing the most to the peak (leading edge subset). q < 0.05 in all plots.
(D) Dot plot of GSEA ES in pathways enriched in Sox6+ neurons.
