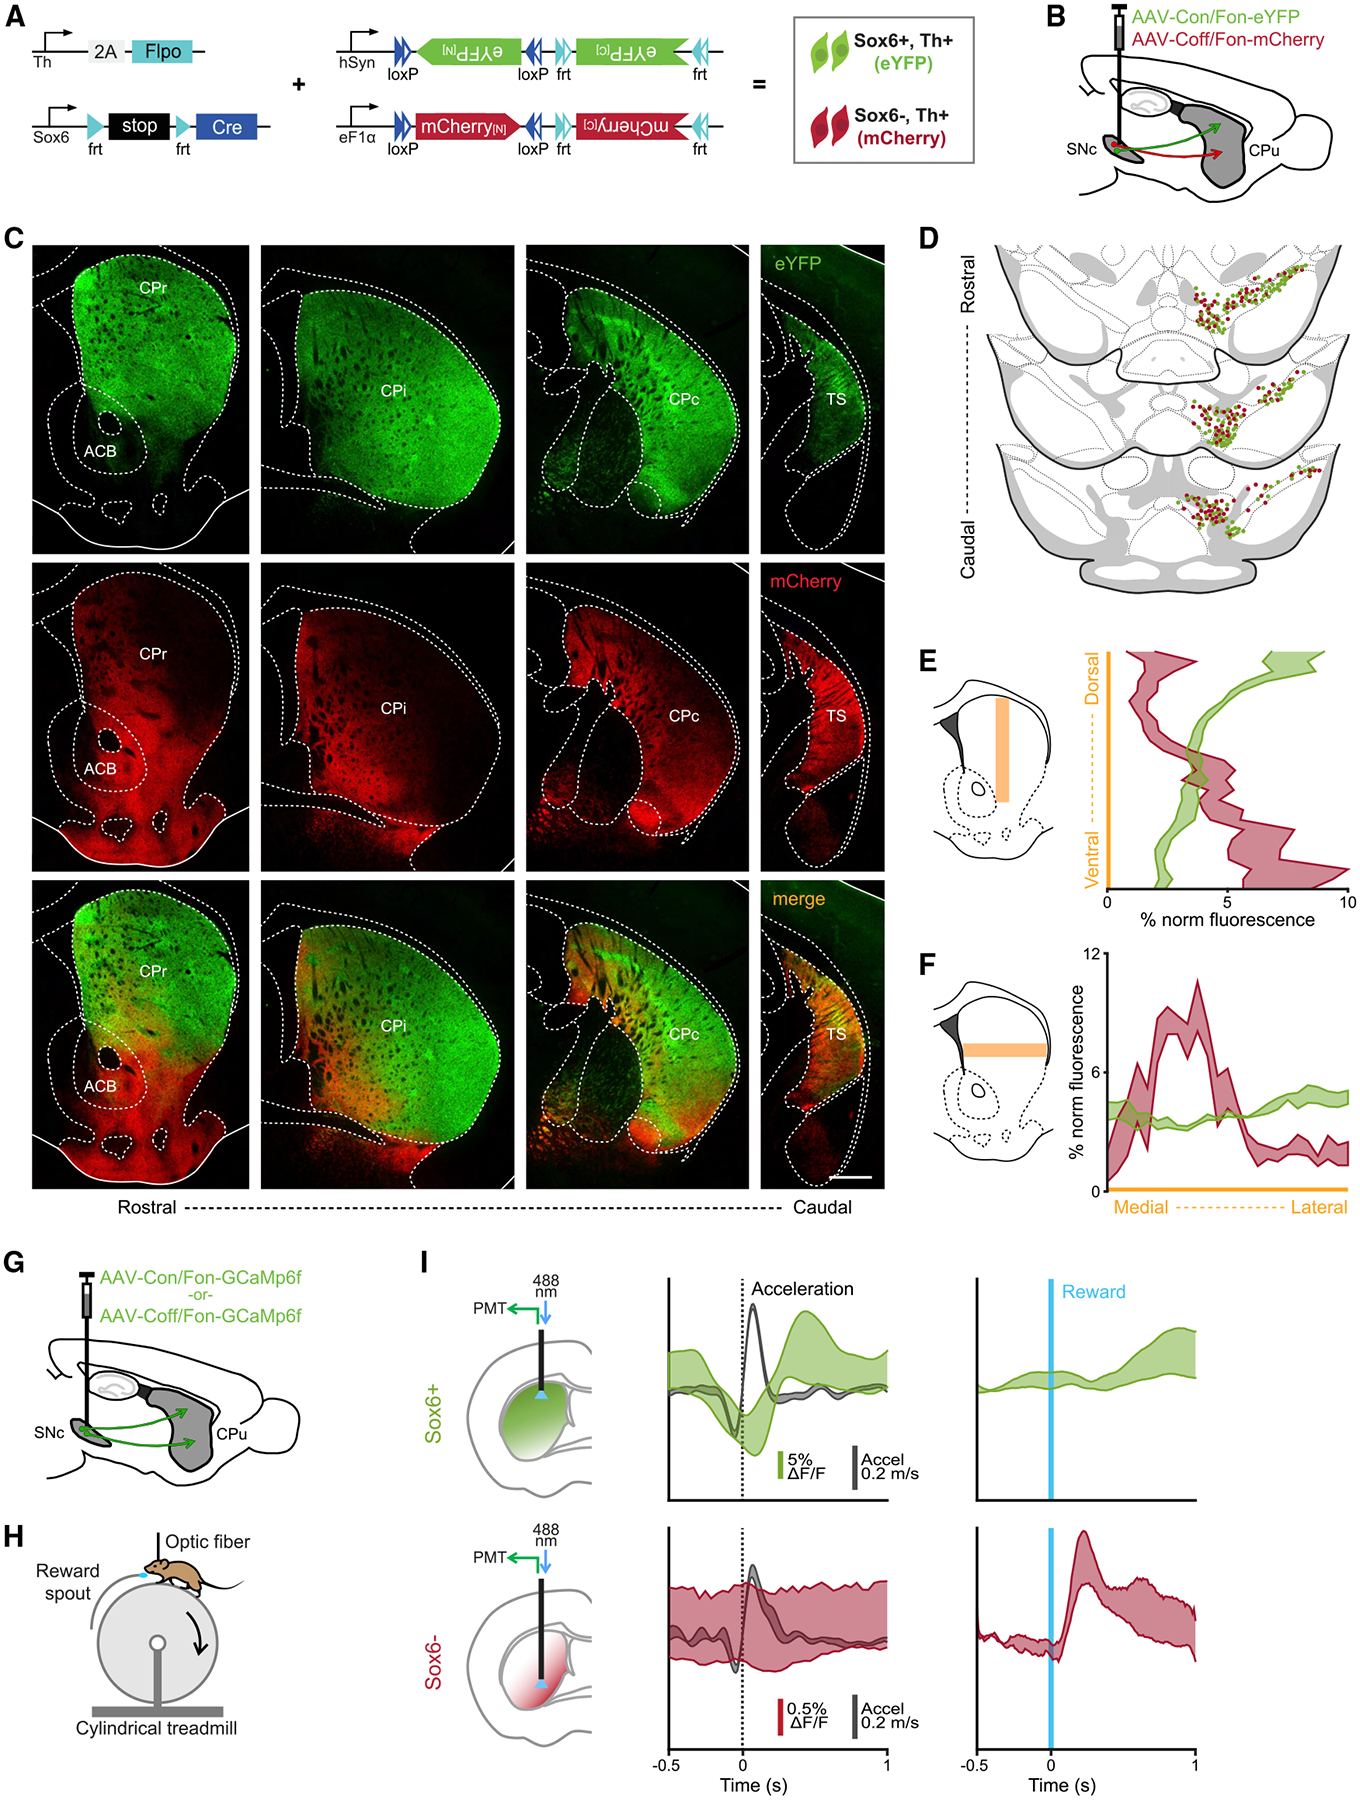
Figure 4. Sox6+ and Sox6− populations have distinct and inverted projection patterns.

(A) Genetic strategy used to simultaneously label Sox6+ and Sox6− neurons and their projections in adult brains.
(B) Schematic showing injection location (SNc).
(C) Projections across the rostro-caudal axis of the striatum from Th+Sox6+ dSNc neurons (EYFP, top), from Th+Sox6− vSNc neurons (mCherry, center), and merged images (bottom).
(D) Representation of labeled cells in the midbrain corresponding to (C). Each dot represents 3 labeled cells.
(E) Histogram of normalized fluorescence for EYFP and mCherry axons along the dorsoventral axis of the striatum (CPr and CPi). Left, representation of the region of the striatum used for quantification.
(F) Histogram of normalized fluorescence for EYFP and mCherry axons along the mediolateral axis of the striatum (CPr and CPi). Left, representation of the region of the striatum used for quantification.
(G) Schematic showing strategy used to label Sox6+ or Sox6− neurons in different mice with GCaMP6f.
(H) Simplified representation of experimental setup.
(I) Recording of Sox6+ (top) and Sox6− (bottom) axons in the dorsal and ventral striatum, respectively in the regions of most dense innervation for each population. Left: schematic of recording location for each population. Center: triggered average at acceleration onsets (acceleration in black, %ΔF/F in red/green) (Sox6+ n = 9, Sox6− n = 2). Right: triggered average at reward delivery, %ΔF/F scale same as in the center (Sox6+ n = 6, Sox6− n = 2).
Shaded areas (E, F, I) are SEMs. Scale bar, 500 μm. CPr: caudate putamen rostral; Cpi: caudate putamen intermediate; CPc: caudate putamen caudal; TS: tail of the striatum; ACB: nucleus accumbens.
(A)–(F) n = 3.
